The CM Williams Fix Indicator for MetaTrader 5 is one of the most popular indicators on the TradingView platform, now available for MT5 users. This tool identifies special market conditions and delivers reliable, high-quality buy signals. Simply attach it to your chart and experience its outstanding performance in your trading.
Type: indicator Market: all markets TimeFrames: all timeframes Trading type: all trading types from scalping to position trading
How Does It Work?
This indicator is specifically designed to provide buy signals in the market. It combines calculations from Bollinger Bands and momentum to detect accurate entry points. After the appearance of the gray lines, you will see green lines, and the first green bar indicates a buy signal.
By combining this indicator with your personal trading strategy, you can find excellent entry opportunities and improve your overall trading performance.
Built-in Tester
One of the strongest features of this indicator is the built-in tester panel. It allows you to check how the signals are within a specific period, using your defined stop loss and take profit levels. This feature makes it easy to evaluate the indicator before using it in live markets.
Conclusion
The CM Williams Fix Indicator for MT5 is a powerful tool that helps traders identify buy opportunities with accuracy and confidence. Add it to your charts, combine it with your strategy, and see why it is considered one of the most rated indicator in the market.
The Smart Squeeze Momentum Indicator MT5 is a powerful trading tool that helps traders identify periods of market contraction, expansion, and potential trend reversals. Built on the proven concepts of Bollinger Bands and Keltner Channels, this indicator detects “squeeze” conditions and provides a clear momentum histogram along with buy and sell trading signals.
Key Features
Momentum Histogram – Visualizes the strength and direction of market momentum.
Use True Range – Enable advanced calculation for precise results.
Tester Options – Backtest with start date, take profit (TP), and stop loss (SL) in points.
How It Works
A squeeze condition occurs when Bollinger Bands contract inside the Keltner Channels, signaling low volatility.
When volatility expands, Bollinger Bands break outside the channels, indicating potential momentum shifts.
The histogram color changes according to momentum direction and intensity.
Buy and sell arrows appear when squeeze releases align with momentum confirmation.
Why Traders Use It
Detects high-probability breakout setups in Forex, stocks, indices, and crypto.
Helps capture trend reversals and momentum trades with precision.
Provides clear visual signals for discretionary traders and buffer outputs for automated Expert Advisors (EAs).
Additional Notes
All buffers (histogram, squeeze, buy, and sell) are fully available for EA integration.
Designed for analytical and educational purposes – does not guarantee profits.
Compatible with the MetaTrader 5 (MT5) platform.
Perfect for traders looking to master volatility breakouts, improve momentum trading strategies, and combine Bollinger Band squeeze setups with automated or manual trading systems.
The Market Structure Break & Order Block (MSB-OB) indicator is built to analyze price structure, highlight market structure breaks, and mark order block zones. It also provides buffers for Buy/Sell signals and MSB detection, making it suitable for both manual analysis and automated strategies. A tester panel is included to evaluate performance under different conditions in the Strategy Tester.
Main Concept
Market Structure Break (MSB): Occurs after price breaks an old high and then forms a lower low, or after price breaks an old low and then forms a higher high.
Order Blocks (OB): Appear after MSB. If the MSB is bearish, the OB is the last bullish candle before the high. If the MSB is bullish, the OB is the last bearish candle before the low.
Breaker and Mitigation Blocks: These are blocks formed in the low area before the last high (bearish case) or in the high area before the last low (bullish case). The last bearish candle for bearish, and the last bullish candle for bullish, act as mitigation or breaker blocks.
Features
Buy/Sell signal buffers for easy EA integration.
MSB buffers for automated detection of structure breaks.
Order block, breaker, and mitigation zones displayed directly on the chart.
ZigZag-based structure with adjustable parameters.
Tester panel to experiment with settings in the Strategy Tester.
Fully customizable colors, widths, and label sizes.
Inputs
ZigZag Length – swing point sensitivity.
Show ZigZag – option to show or hide ZigZag lines.
Fib Factor – fib-level confirmation for breakouts. Example: if a new high is larger than the old high-to-low × (1 + Fib Factor) during a downtrend, then it is considered a breakout.
Colors and Styles – order block, breaker block, and MSB visualization.
Font Size / Line Width – for labels and lines.
Notes
Signal and MSB buffers are available for automation.
Tester panel allows performance evaluation under different market conditions.
All input parameters, output messages, and descriptions are provided in English.
The indicator is intended for analytical use and does not guarantee or promise trading results.
The Slope MA With Tester is a technical indicator that evaluates the slope of a moving average relative to volatility (ATR). It highlights directional bias through a color-coded slope line and plots entry arrows when slope conditions change.
Main features:
Slope-based Calculation – The slope of an EMA is normalized by ATR, allowing comparison across symbols and timeframes.
Color-Coded Slope Line – Changes color when slope values exceed user-defined upper or lower thresholds.
Buy & Sell Arrows – Arrows are plotted when slope conditions shift across thresholds.
Configurable Parameters – EMA period, ATR period, and threshold levels can be adjusted.
Integrated Tester Panel – Optional on-chart panel displays the number of signals, trade outcomes, and win rate based on TP/SL levels set in points.
How it works:
ATR provides a scale for normalizing slope changes of the EMA.
When slope values exceed the defined levels, the indicator signals potential buy or sell conditions.
Arrows mark transitions between slope states.
If the tester is enabled, the panel calculates trade statistics starting from the selected date using the specified TP/SL values.
Applications:
Identifying slope shifts that may indicate the beginning or end of directional momentum.
Filtering signals with ATR-based normalization to adapt across different markets.
Reviewing historical signal behavior through the built-in tester.
The Two-Pole Oscillator is an analytical tool based on deviation
calculations and a two-pole smoothing filter. It is designed to
highlight momentum conditions and potential trading signals while
filtering out short-term noise.
Main features:
Two-Pole Filtering – Reduces chart noise for smoother oscillator curves.
Deviation-Based Calculation – Shows overbought and oversold conditions relative to a dynamic mean.
Signal Strength Gradient – Values near zero indicate weaker conditions, while values closer to ±1 indicate stronger conditions.
Validation Levels – Automatic invalidation levels are plotted for each signal. If price crosses the level, the signal is marked as invalid.
Chart Display – Signals and validation levels are shown directly on the chart for clear visual reference.
How it works:
Price deviation is measured relative to a moving average.
The result is filtered using a two-pole smoothing method.
Gradient coloring illustrates relative signal strength.
Signals are generated on crossovers, with invalidation levels providing confirmation or cancellation.
Possible applications:
Identifying overbought and oversold market conditions.
Defining stop-loss or reversal zones using validation levels.
Filtering weak signals and focusing on stronger momentum setups.
Combining oscillator readings with price action for additional confirmation.
This
indicator provides an alternative approach to standard oscillators by
combining deviation measures, smoothing techniques, and automatic
validation. It can be applied to any symbol and timeframe for systematic
momentum analysis.
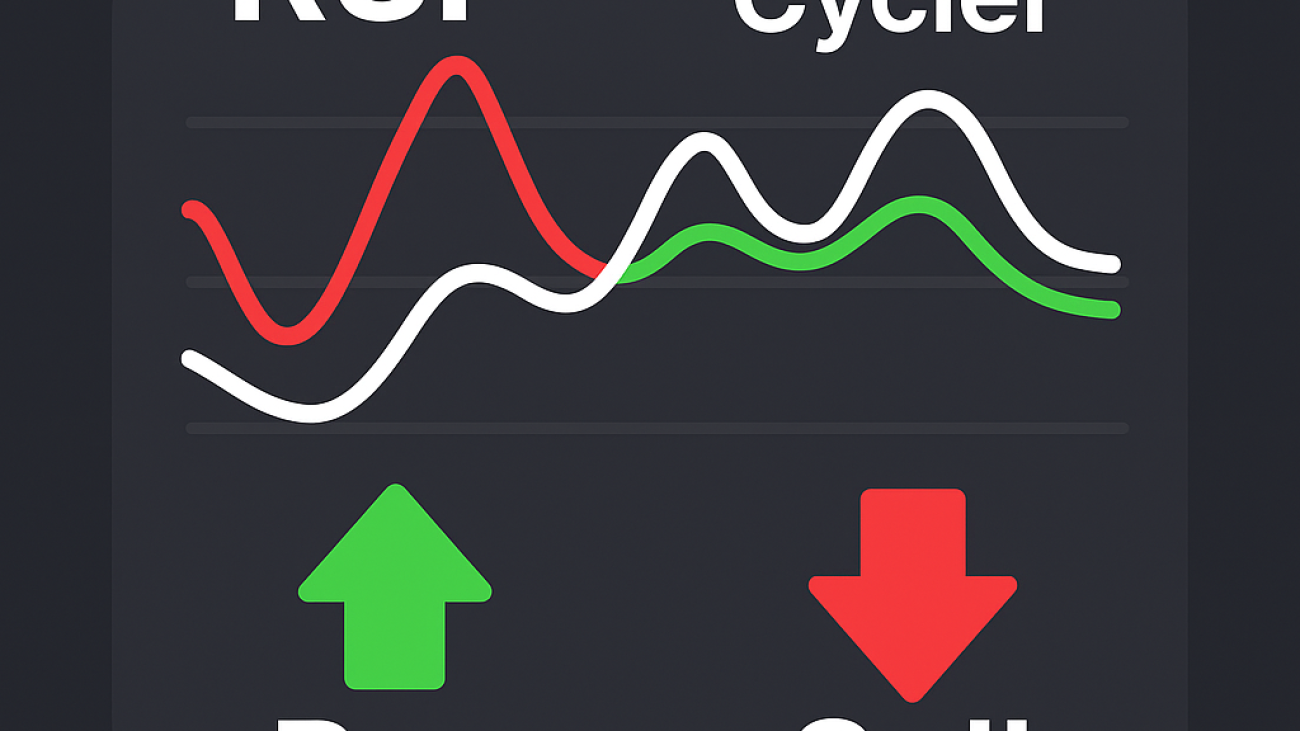
This indicator is an enhanced version of the
Relative Strength Index (RSI) with additional features for visual
clarity and cycle detection. It is designed to provide traders with a
clearer view of momentum conditions and potential turning points.
Main features:
Improved RSI Visualization – The indicator displays RSI values with color-coded zones for overbought and oversold conditions.
Cycle Detection (Cycler) – Identifies possible market turning points using dynamic cycle-based filters.
Chart Signals – Buy and Sell markers are displayed directly on the chart when conditions are met.
Integrated Statistics Panel – A built-in panel provides information on the number of signals generated, wins, and win rate for reference.
Customizable Parameters
– Users can configure RSI periods, overbought/oversold levels, cycle
values, take-profit and stop-loss levels, as well as the start time for
the statistics panel.
Key advantages:
Combines RSI readings with cycle detection for diversified signal conditions.
Visual representation with colors and chart markers for easier interpretation.
Provides statistical feedback on signal history directly within the platform.
Can be applied to any instrument and any timeframe.
This tool is intended for traders who wish to analyze momentum conditions with an alternative approach to the standard RSI.
The Madrid Ribbon is a moving average–based trend visualization tool.
It combines multiple exponential or simple moving averages into a
ribbon structure that adapts to market changes. The indicator highlights
trend direction, possible reentry zones, and areas where reversals may
occur.
Main features:
Dynamic Trend Display – Multiple moving averages form a ribbon that reflects the current trend.
Color Coding –
Lime: Uptrend
Green: Pullback or possible reversal warning
Red: Downtrend
Maroon: Peak or possible reversal warning
Configurable Settings – Users can choose between exponential or simple moving averages.
Clear Visualization – Designed for uncluttered display, with best results on dark chart backgrounds.
How it works:
Several moving averages are layered to form a ribbon.
Ribbon color changes according to the prevailing momentum.
Pullback and potential reversal zones are highlighted to provide additional context for decision-making.
Possible applications:
Identifying the prevailing market trend.
Highlighting possible reentry points during pullbacks.
Spotting areas where reversals may develop.
Supporting trend-following strategies across Forex, cryptocurrencies, stocks, and indices.


")
")
")


")
")
")


")

")
")
")
")
")
")

")
")
")
")