Kagi Chart

Kagi Chart MT5 – True Price Action Indicator

KagiChart for MetaTrader 5

Introduction

KagiChart is a time-independent charting indicator designed for MetaTrader 5.
It renders Kagi lines directly on the chart window, focusing on price movement and reversal structure rather than time-based candles.

What is a Kagi Chart

Kagi is a charting method that represents price movement without using fixed time intervals.
Instead of plotting candles at regular time steps, the chart changes direction only when price reverses by a defined amount.

The chart consists of continuous lines that reflect market structure:

  • Yang lines represent upward movement after price exceeds a previous high
  • Yin lines represent downward movement after price falls below a previous low

This approach helps visualize trend structure and price movement without time-based noise.

Indicator Logic

The indicator builds Kagi lines using reversal thresholds.
A new segment is created only when price moves beyond the defined reversal level.

  • Upward movement continues until a downward reversal condition is met
  • Downward movement continues until an upward reversal condition is met
  • Trend state changes when previous structural levels are broken

Rendering Features

  • Vertical segments connected by horizontal lines
  • Even column spacing based on bar index
  • Consistent spacing regardless of time gaps
  • Accurate handling of session gaps and weekends
  • Yang and Yin transitions occur at the exact price level where structure is broken
  • Mid-segment transitions are supported

Features

Reversal Modes

  • Percentage based reversal
  • ATR-based reversal
  • Fixed price reversal
  • Broker point-based reversal

Visual Settings

  • Custom colors for Yang and Yin states
  • Adjustable line thickness
  • Configurable column width
  • Optional even-spacing mode

Information Display

  • Current Yang or Yin state
  • Swing count
  • Current trend direction

Alerts

  • Optional notification when trend state changes

Performance Control

  • Adjustable maximum number of processed bars

Usage

The indicator can be used to observe price structure and trend changes based on reversal logic.
It may also be combined with other analytical tools.

Limitations

  • This is a visualization indicator and does not execute trades
  • It does not provide trading signals as indicator buffers
  • It does not expose data buffers for Expert Advisor integration
  • The chart is recalculated on each update
  • It does not predict future market behavior

Installation

  1. Open MetaEditor in MetaTrader 5
  2. Place the file in the MQL5/Indicators folder
  3. Compile the file
  4. Attach the indicator to a chart from the Navigator panel
  5. Adjust input parameters as needed

Recommended Settings

  • Forex: ATR mode, period 14
  • Indices and metals: Percentage mode
  • Crypto: Percentage mode with higher values

Settings can be adjusted depending on instrument volatility and preferred sensitivity.

Notes

Kagi charts are designed to reduce the impact of small price fluctuations.
They may show fewer movements during low-volatility conditions and more structure during directional moves.

Disclaimer

This indicator is provided for analytical purposes only.
It does not provide investment advice and does not guarantee results.


Kagi Chart
Kagi Chart
Kagi Chart
Kagi Chart
RMI

The Week That Changed Everything — How RMI Trend Sniper Would Have Caught Every Major Move

Last week was one of the most extreme in recent forex history. The FOMC delivered a vote split not seen in over three decades. Japan spent ¥5.4 trillion ($34.5 billion) in a single intervention that triggered the yen’s sharpest rally in three years. Gold crossed $5,000 per troy ounce for the first time ever. Oil broke triple digits and has not looked back. Markets open this weekend pricing in the reignition of Iran war risk after Trump’s peace deal fell through. The question for next week is not whether there will be trends — it is whether you have a tool built to catch them cleanly.

When markets move the way they moved last week, the difference between a profitable and a losing week comes down to a single factor: did you identify the trend early enough to ride it, or did you enter late and get trapped in the reversal? The gap between those two outcomes is not luck. It is trend identification speed — and that is precisely what the RMI Trend Sniper Indicator for MT5 is engineered to solve.

The RMI (Relative Momentum Index) Trend Sniper combines the smoothness of a momentum oscillator with the directional clarity of a trend filter — giving you early entry signals at the start of new trends while filtering out the choppy, sideways noise that traps most momentum traders. In a week when USD/JPY moved over 400 pips in a single session on BoJ intervention, and gold broke a historic threshold, the ability to get positioned at the start of the move — not after it — is worth more than any after-the-fact analysis.

01What Makes the RMI Different from Standard RSI

Most traders are familiar with the Relative Strength Index. The RMI is its more sophisticated successor — designed to address RSI’s core weaknesses while preserving its interpretive simplicity.

Standard RSI compares the current close to a single previous close, creating a measurement that is sensitive to individual candle anomalies and prone to generating overbought/oversold readings that persist through strong trends. The result is an indicator that tells you a trend is “overbought” while price continues climbing for another 200 pips — a problem every experienced trader has encountered.

The RMI replaces the single-close comparison with a momentum lookback period — comparing the current close to the close from N periods ago rather than the immediately previous candle. This single modification produces dramatically smoother readings, reduces false divergence signals, and — critically — allows the indicator to stay aligned with trends rather than fighting them.

01

Smoother Readings

The momentum lookback period averages out single-candle spikes that cause RSI whipsaws. During last week’s BoJ intervention, the RMI stayed short on USD/JPY while standard RSI bounced into oversold territory and prematurely signalled a reversal.

02

Trend Alignment

The Trend Sniper layer on top of the RMI keeps the indicator directionally locked until the trend genuinely reverses. This is what allows it to stay long on gold through the entire move from $4,600 to $5,000 without triggering premature exit signals.

03

Early Entry Signals

By detecting momentum shifts before they fully manifest in price, the RMI Trend Sniper fires its signal at the beginning of a new trend leg — not after the move has already delivered most of its pips to those who entered earlier.

02Last Week Through the RMI Lens — Four Major Trends

The week of April 27–May 1 gave traders four distinct high-quality trend opportunities. Here is how the RMI Trend Sniper would have read each one.

USD/JPY — Intervention Crash

The RMI was already showing bearish divergence on USD/JPY as it pressed 160.40 — momentum was weakening while price pushed higher. When intervention hit and the pair crashed over 400 pips, the Trend Sniper had already shifted to a short signal. Traders following the indicator were positioned, not reacting.

Gold — Historic $5,000 Break

The RMI maintained a bullish trend signal through gold’s entire ascent, never triggering the premature reversal signals that standard RSI would have generated as gold pushed through “overbought” territory at $4,700, $4,800, $4,900 and then $5,000.

Crude Oil — Triple-Digit Hold

WTI broke above $100 and held. The RMI’s early bull signal fired at the $98 retest after the initial break, positioning trend traders ahead of the run toward $106 and beyond. Exxon’s CEO confirmed the market hasn’t seen the full supply disruption impact yet.

EUR/USD — Downside Pressure

EUR/USD slipped below 1.17 under the weight of weak Eurozone growth and US dollar strength from the FOMC’s hawkish split vote. The RMI generated a clean bear signal at the break below 1.1700 with a retest to 1.1720 that confirmed the downside continuation.

03How the Trend Sniper Signal Works

The RMI Trend Sniper is not a simple overbought/oversold indicator. Its signal logic operates on two layers simultaneously — the underlying RMI momentum reading, and a trend filter that determines whether momentum is aligned with the directional structure of the market.

🎯 Bullish Trend Sniper Signal
  1. RMI crosses above its signal line from below the midpoint
  2. Trend filter confirms price is in a bullish structure on this timeframe
  3. Momentum is accelerating — RMI slope is positive and increasing
  4. Signal arrow fires on candle close — no repainting
🎯 Bearish Trend Sniper Signal
  1. RMI crosses below its signal line from above the midpoint
  2. Trend filter confirms price is in a bearish structure on this timeframe
  3. Momentum is accelerating downward — RMI slope is negative and steepening
  4. Signal arrow fires on candle close — confirmed, not intrabar

The dual-layer logic is what sets the Trend Sniper apart from basic RMI implementations. Without the trend filter, an RMI crossover in a ranging market generates signals in both directions with roughly equal frequency — most of which are false starts. The trend filter eliminates crossovers that occur against the prevailing structure, dramatically improving signal quality without reducing frequency in genuinely trending markets.

04Configuring the RMI Trend Sniper for Next Week’s Market

The market opening next week faces significant uncertainty: Iran war reignition risk, gold at historic highs, USD/JPY post-intervention positioning, and Kevin Warsh’s incoming Fed Chair tenure beginning in mid-May. Here is how to configure the indicator for this environment.

Parameter Function Recommended for Current Conditions
RMI Period The primary smoothing period. Lower values = faster signals with more noise; higher values = slower but cleaner signals. 12–14 for H1 trending markets; 8–10 for H4 swing trades this week
Momentum Lookback How far back the RMI compares closes. This is the key differentiator from RSI. Higher lookback = smoother, more trend-aligned readings. 4–6 for volatile, fast-moving markets like current JPY and Gold
Trend Filter Period The period of the trend filter that determines whether signals are with or against the prevailing structure. 50-period for H1; 20-period for H4 — keep it longer in high-volatility weeks
Signal Sensitivity Determines how far the RMI must cross its signal line before an arrow fires. Higher sensitivity = more signals; lower = fewer but higher quality. Reduce sensitivity this week — geopolitical news creates many false crossovers
Alert Type Popup, push notification, or email alert when a signal fires. Enable push notifications — weekend gap opens and Monday opens need instant alerts

05Weekend Preparation — How to Set Up for Next Week

Saturday and Sunday are not rest days for a prepared trader. They are the most valuable analysis window of the week — when the market is closed, you can think clearly without the pressure of live prices. Here is your RMI Trend Sniper preparation framework for the week ahead.

01

Review the weekly candle close on your key pairs

The weekly candle close is the highest-conviction structural signal available. Pull up USD/JPY, XAU/USD, EUR/USD, and WTI on the weekly chart. Note where the RMI Trend Sniper is reading right now — bullish, bearish, or neutral. This is your directional bias for the entire week ahead. Do not trade against it unless a major news event changes the macro picture.

02

Mark the key levels where signals would be highest-probability

Identify the support and resistance zones on H4 where the next RMI Trend Sniper signal would be most meaningful. For gold, that is the $4,950–$5,000 retest zone. For USD/JPY, the $155–157 post-intervention consolidation range. For EUR/USD, the 1.1620 key support that OANDA identified as the next major battleground.

03

Check the economic calendar for next week’s volatility windows

The week of May 4–8 includes the US ISM Services PMI, several Fed speaker appearances including Powell’s first post-FOMC comments, and ongoing Hormuz geopolitical risk. Disable or widen your signal sensitivity during the highest-impact windows — the indicator’s signal quality drops when news-driven volatility creates non-structural momentum crossovers.

04

Configure your alerts before Sunday night

The Asian session open on Sunday evening (20:00–21:00 GMT) is when the first market reaction to weekend geopolitical developments occurs. This week, with Iran war reignition risk elevated after Trump’s failed peace deal, the Sunday open could be sharply risk-off. Set your push notification alerts on your key pairs before Sunday evening so the indicator can alert you to the first directional signal of the week.

05

Define your risk parameters before the week begins

In a high-uncertainty week like the one ahead, position sizing is as important as signal quality. Decide your maximum risk per trade as a percentage of account — and stick to it regardless of how strong the RMI signal looks. Geopolitical gap risk is real, and the indicator cannot price in a Sunday night Hormuz headline. Risk management is the last line of defence that no indicator can replace.

06Why Momentum Indicators Fail in Intervention Markets — and How RMI Handles It

The BoJ’s $34.5 billion intervention last Thursday is a masterclass in why conventional momentum indicators break down during policy-driven events. When USD/JPY was at 160.40 and intervention hit, standard RSI was deep in “overbought” territory — but had been there for days without price reversing. Most RSI-based systems were either already short (and got stopped out before the real move) or were not positioned at all.

⚠️

Standard RSI gives premature overbought/oversold signals in trending markets. USD/JPY was “overbought” on RSI-14 for over a week before the intervention. Traders shorting on RSI overbought alone were repeatedly stopped out. The RMI’s momentum lookback prevents this by requiring genuine momentum deceleration — not just an elevated reading — before generating a reversal signal.

🏦

Central bank intervention creates non-structural momentum spikes. When $34.5 billion hits the market in a short window, the price move is genuine but the momentum signal is artificially amplified. The RMI Trend Sniper’s trend filter helps by requiring that the post-intervention structure confirms the new direction on candle close — preventing entry on the spike itself and waiting for the structural confirmation.

📊

Divergence signals are unreliable in intervention-driven moves. During the USD/JPY crash, many traders saw RSI divergence on lower timeframes and tried to fade the move — only to find the intervention had more firepower than any divergence signal could anticipate. Use RMI divergence as a warning, not a trigger, in weeks with confirmed or threatened central bank action.

🌙

Weekend gap risk cannot be signalled in advance. No indicator — including the RMI Trend Sniper — can tell you what a Sunday night gap will do to your open positions. The single most important risk management action you can take this weekend is to close or reduce any positions you would not be comfortable holding through a 150+ pip gap open, and set hard stop losses on everything else before Sunday evening.

07The Week Ahead — RMI Trend Sniper Bias for Key Markets

Based on the weekly candle closes and the current RMI Trend Sniper readings across the major markets, here is the directional bias entering the week of May 4–8.

🥇
Gold (XAU/USD) — Bullish bias above $4,950. Historic $5,000 breakout intact. RMI weekly reading is bullish. Any retest of $4,950–$5,000 with a bullish H4 RMI signal is the highest-quality long setup of the week.
💴
USD/JPY — Bearish bias below 158.00. Post-intervention structure is bearish. Watch for RMI bear signals on bounces toward 157.50–158.00. BoJ has shown it will defend the yen — every rally is a potential fade.
💶
EUR/USD — Neutral. Key level 1.1620. Weekly candle closed indecisively. Wait for a confirmed RMI signal after the weekly open before committing to direction. A break below 1.1620 opens 1.1535; a hold above 1.1700 reopens 1.1835.
🛢️
WTI Crude — Bullish above $103.30. Exxon CEO confirmed prices do not yet reflect the full supply disruption. RMI trend signal remains bullish. $103.30 is the line — below it, the structure changes.
⚠️
All pairs — Elevated gap risk Sunday night. Iran war reignition fears and the Trump peace deal collapse mean the Sunday open carries above-average gap risk. Reduce position sizes and ensure hard stops are in place before Sunday evening.

Catch the Next Big Trend Before It Runs Without You

The RMI Trend Sniper for MT5 fires early-entry signals at the start of new trend legs — combining RMI momentum with a structural trend filter to eliminate the noise and keep you aligned with the move that matters. No repainting. Push notification alerts. Works on all pairs and timeframes.

Conclusion

The week of April 27–May 1 handed traders four exceptional trend opportunities — the yen intervention crash, gold’s historic $5,000 break, crude oil holding triple digits, and EUR/USD’s breakdown below 1.17. Every one of these was a momentum trend. Every one required an indicator capable of identifying the trend early and staying with it through the noise. That is exactly what the RMI Trend Sniper is built to do.

🎯
RMI Trend Sniper fires early — at the start of the trend, not the middle
📈
Dual-layer logic filters noise — no crossovers against the prevailing structure
🔔
Push alerts ready for Sunday open — never miss the first move of the week
🛡️
No repainting — the signal you see is the signal that fired

Next week will bring more trends. Gold will move. The yen will react to every Iran headline. Crude will respond to every Hormuz development. The question is not whether there will be opportunities — it is whether you are positioned at the start of them or chasing them from behind. Set up the RMI Trend Sniper this weekend and go into next week ready.

Disclaimer: This article is for educational and informational purposes only. It does not constitute financial or investment advice. Trading forex and financial instruments carries significant risk. Past performance of any indicator does not guarantee future results. Always practise proper risk management.
Oil Trader

WTI Crude at $106: How to Trade the Hormuz Supply Shock with a Dedicated MT5 Indicator

WTI crude oil is trading at $106 a barrel today — May 1, 2026 — as the Strait of Hormuz remains largely blocked for the third consecutive month. The EIA reports 9.1 million barrels per day of Persian Gulf supply shut in during April alone, draining global inventories at a record pace. Goldman Sachs sees Brent averaging above $100 for the year. The EIA forecasts a Q2 peak near $115. For traders, this is not a commodity story. It is the most significant directional driver in markets right now — and it demands a dedicated tool.

Crude oil trades differently from forex pairs. Its price is moved by a unique combination of geopolitical risk premium, inventory data, OPEC+ decisions, seasonal demand cycles, and refinery capacity constraints. Generic indicators calibrated for currency pairs frequently produce false signals on WTI and Brent because they do not account for these structural drivers. The result is that many traders apply the same RSI or MACD setup they use on EUR/USD to a commodity with fundamentally different volatility characteristics — and wonder why their signals keep misfiring.

The Crude Oil Buy/Sell Indicator for MT5 is purpose-built for this market. It is calibrated specifically for crude oil’s volatility profile, price structure, and session behaviour — delivering buy and sell signals that account for the way oil actually moves, not the way a generic momentum indicator assumes it does. On a day when WTI is at $106 and every major bank is revising its price forecast upward, this is exactly the kind of edge that separates oil traders from the rest of the market.

01Why Crude Oil Demands Its Own Dedicated Indicator

The price of crude oil is shaped by forces that do not affect forex pairs. Understanding these forces is the prerequisite to trading oil profitably — and it explains why the Crude Oil Buy/Sell Indicator is built the way it is.

01

Geopolitical Risk Premium

Oil prices carry a built-in geopolitical premium that spikes during supply disruptions. The current Hormuz closure has added an estimated $15–20 premium per barrel. This makes oil more sensitive to news flow than almost any other tradeable asset — and requires signal logic that accounts for volatility expansion during geopolitical events.

02

Inventory-Driven Volatility

The EIA Weekly Petroleum Status Report (every Wednesday) and the API report (every Tuesday) are the two most consistent volatility triggers in crude oil. A surprise inventory draw of even 2–3 million barrels can move WTI by $2–4 in minutes. Oil-specific indicators must be robust to these scheduled, high-amplitude events.

03

Session and Seasonal Patterns

Crude oil has distinct intraday patterns tied to the US open (09:30 ET), the EIA window, and end-of-day position squaring. It also has seasonal demand patterns — summer driving season, winter heating demand — that influence multi-week trend behaviour. A purpose-built indicator accounts for these cycles; a generic one does not.

02Reading the Hormuz Market — What the Charts Are Showing

The Hormuz closure, now in its third month, has created the most sustained directional crude oil trend since 2022. Understanding the current market structure is essential context for applying the indicator effectively right now.

Primary Trend — Bullish

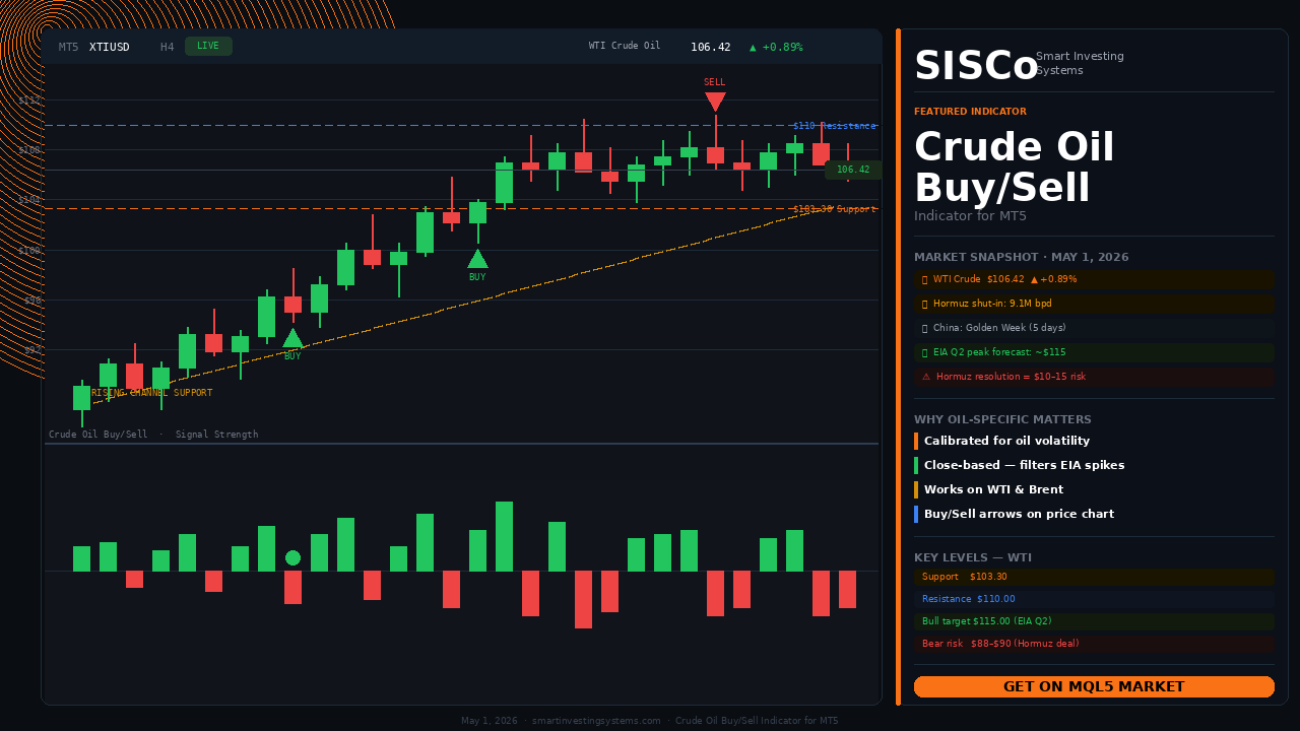
WTI has been in a sustained uptrend since the Hormuz blockade began in late February. The indicator’s primary trend signal has been bullish throughout, with pullbacks to the $100–$103 support zone representing the key re-entry opportunities on the long side.

Current Zone — Consolidation

At $106, WTI is consolidating below the $110 resistance zone that represents the next major supply area. Today’s session is characterised by reduced volatility as China begins its five-day Golden Week holiday, removing a significant demand participant from the market temporarily.

Key Risk — Hormuz Resolution

Trump has signalled the Iran war is effectively won and is pushing for guarantees on nuclear non-proliferation. Any credible Hormuz reopening signal could trigger a $10–15 rapid correction. The indicator’s sell signal logic is designed to catch these sharp reversals when sentiment shifts.

Goldman Sachs currently forecasts Brent averaging above $100 for the full year, while the EIA projects a Q2 peak near $115. The bull case relies on the Hormuz disruption persisting through Q2. The bear case — a diplomatic breakthrough — could unwind the risk premium rapidly. Both scenarios are tradeable. The Crude Oil Buy/Sell Indicator is built to signal in both directions.

03Buy and Sell Signal Logic — How the Indicator Reads Crude

The indicator combines trend identification, momentum confirmation, and volatility filtering into a single signal output. Rather than displaying a complex multi-panel setup, it delivers clear buy and sell arrows directly on the price chart — with the underlying logic doing the heavy lifting invisibly.

🛢️ Buy Signal Conditions
  1. Price above the medium-term trend baseline — oil in a bullish structure
  2. Momentum shifts from negative to positive — buying pressure increasing
  3. Volatility above the minimum threshold — market is active, not ranging
  4. Signal fires on candle close — not intrabar, eliminating spike noise
🛢️ Sell Signal Conditions
  1. Price below the medium-term trend baseline — bearish structure established
  2. Momentum turns negative — selling pressure confirmed
  3. Volatility confirms the move is genuine — not a thin market reversal
  4. Candle-close confirmation — reduces false signals around news spikes

The candle-close confirmation is particularly important in crude oil. WTI is notorious for sharp intrabar spikes around EIA data releases, API reports, and geopolitical headlines. An indicator that signals on intrabar penetration will generate multiple false entries per week in this environment. Close-based logic eliminates the vast majority of these noise signals.

04Optimal Timeframes and Settings for Current Conditions

Crude oil’s behaviour varies significantly across timeframes. Here is how to configure the indicator for the current high-volatility, geopolitically-driven market environment.

TimeframeBest Use CaseKey Adjustment
M15Scalping around EIA/API data releases. High signal frequency, requires tight stop placement.Reduce trend period; increase volatility minimum threshold to filter non-event noise
H1Intraday swing trades. Best balance of signal frequency and noise reduction for active traders.Default settings work well; consider widening stops during Hormuz news windows
H4Multi-day trend following. Ideal for the current sustained uptrend from $88 to $106.Extend trend baseline period to 20+ for cleaner primary trend reads
D1Macro positioning. Used to identify the primary $100–$115 range structure.Use for direction bias only; execute entries on H1 or H4 signals aligned with D1 trend

For the current Hormuz-driven market, the H4 timeframe is delivering the cleanest signals. The primary trend has been bullish since late February, and the H4 buy signals at the $103 support zone have been the highest-quality re-entry points in the current leg. With China’s Golden Week reducing volume today, the H1 will be noisier than usual — H4 entries are recommended through May 6 when Chinese markets reopen.

05A Practical Trading Framework for Crude Oil in May 2026

01

Establish your macro bias from the D1 chart

Before looking at any signal, check the daily chart. Is the indicator’s trend baseline above or below price? Is the most recent D1 signal a buy or a sell? In the current environment, the D1 has been bullish since February. This means you should be looking for H4 buy signals only — not shorting into a geopolitically-driven primary uptrend unless you see a confirmed D1 trend reversal.

02

Mark the key EIA and API report times for the week

The API report drops every Tuesday around 21:30 GMT. The EIA report drops every Wednesday around 14:30 GMT. These are the two most reliable crude oil volatility events of the week. Do not hold positions through these releases without a clear stop in place. The indicator will signal after the report candle closes — wait for that confirmation rather than anticipating direction.

03

Wait for the H4 buy signal at key support

The current primary support zone is $103.30. If WTI pulls back to this level, wait for the H4 candle to close and the indicator to fire a buy signal before entering. The indicator’s close-based logic will confirm that buyers have defended the level — rather than giving you a premature entry into a continuation of the selloff.

04

Size positions conservatively around geopolitical news windows

Any credible Hormuz reopening signal — a Trump-Iran diplomatic announcement, a naval agreement, or an IAEA inspection framework — could move WTI by $8–12 within a single session. This is tail risk, not normal market risk. Keep position sizes reduced relative to your normal crude oil trades until the geopolitical situation clarifies, regardless of what the indicator is showing.

05

Use the sell signal to manage longs — not only to short

In a primary bullish trend, sell signals are most usefully interpreted as exits from long positions rather than entries into shorts. When the indicator fires a sell signal on H4, consider reducing or closing your long position and waiting for the next buy signal to re-enter. Counter-trend shorts in a Hormuz-driven bull trend carry significantly elevated risk of sharp reversals.

06Mistakes That Cost Crude Oil Traders the Most

⚠️

Trading crude oil with forex indicator settings. RSI periods, MACD lengths, and moving average periods calibrated for EUR/USD produce systematically delayed or early signals on WTI because crude oil’s average true range, session structure, and volatility clustering are fundamentally different. Always use oil-specific indicator calibration.

🛢️

Ignoring the EIA inventory number as a trade invalidator. If you enter a long based on a buy signal and the EIA reports a surprise inventory build (more supply than expected), the fundamental thesis of the trade changes instantly. The indicator will eventually reflect this in a sell signal — but you should already have a plan for managing the trade through the EIA window before you enter.

🌍

Treating the Hormuz premium as permanent. The $15–20 geopolitical premium baked into current crude prices can unwind in hours if a credible diplomatic resolution emerges. Trading at $106 as if the current range is structurally supported — rather than risk-premium-supported — is the single most dangerous assumption in the current market.

📉

Over-leveraging during Chinese market holidays. When China is on Golden Week (May 1–6 this year), crude oil liquidity thins considerably during Asian sessions. Thin markets amplify price swings and increase the probability of stop hunts. Reduce leverage during Asian session hours this week and focus on the European and US sessions for signal execution.

07The Bigger Picture — Why Oil Trading Skills Matter Right Now

Crude oil at $106 is not just a commodity price. It is the primary input into global inflation, the driver of energy-sector equity performance, the reason the BoE is facing a stagflation reckoning, and the variable that makes the ECB’s June decision genuinely uncertain. Every major currency pair is, to some degree, an oil trade right now.

The Canadian dollar (CAD) moves with oil — higher crude is structurally bullish for CAD. The Norwegian krone (NOK) tracks Brent closely. The Russian ruble’s reconstruction is entirely oil-dependent. And the US dollar’s strength partially reflects the US’s position as the world’s largest oil producer — benefiting from the same supply shock that is crushing European energy importers.

Understanding crude oil — and having a dedicated, calibrated tool to trade it — is therefore not a niche skill right now. It is central to understanding the macro environment that is driving every other asset you trade. The Crude Oil Buy/Sell Indicator gives you the dedicated signal layer that generic tools cannot.

🛢️
Purpose-built for crude oil — not a repurposed forex indicator
📈
D1 trend bias + H4 entry signal = highest-quality crude oil trade framework
🔔
Close-based confirmation filters EIA/API spike noise automatically
Buy and sell arrows directly on price chart — zero interpretation required
🌍
Works on WTI and Brent — trade the world’s most important commodity

Trade the $106 Crude Oil Market with a Dedicated Edge

The Crude Oil Buy/Sell Indicator for MT5 is purpose-calibrated for WTI and Brent — delivering clear, close-confirmed buy and sell arrows that account for oil’s unique volatility, session structure, and geopolitical sensitivity.

Conclusion

The Strait of Hormuz has been reshaping global markets for three months. WTI at $106, Goldman Sachs forecasting above $100 for the year, and the EIA projecting a Q2 peak near $115 — the crude oil trade is one of the clearest directional opportunities in markets right now. But it requires the right tool. Generic indicators calibrated for forex pairs will not give you the oil-specific signal quality you need to navigate this environment profitably.

🛢️
Crude oil at $106 — biggest supply disruption the market has ever seen
📐
$103.30 support is the key level — wait for H4 buy signal confirmation
🌍
China Golden Week reduces liquidity this week — size down during Asian sessions
⚠️
Hormuz resolution = $10–15 rapid correction risk — always manage tail risk

Use the right tool for the right market. The Crude Oil Buy/Sell Indicator is built for exactly this environment — and exactly this moment in the commodity cycle.

Disclaimer: This article is for educational and informational purposes only. It does not constitute financial or investment advice. Trading forex and financial instruments carries significant risk. Past performance of any indicator does not guarantee future results. Always practise proper risk management.