
Crude Oil Indicator for MT5
A short-term crude oil buy/sell indicator for MetaTrader 5, built for 3-minute charts to find high-probability entries in oil price moves.
- MetaTrader 5
- Works on VPS
- Lifetime support
About Crude Oil Indicator for MT5
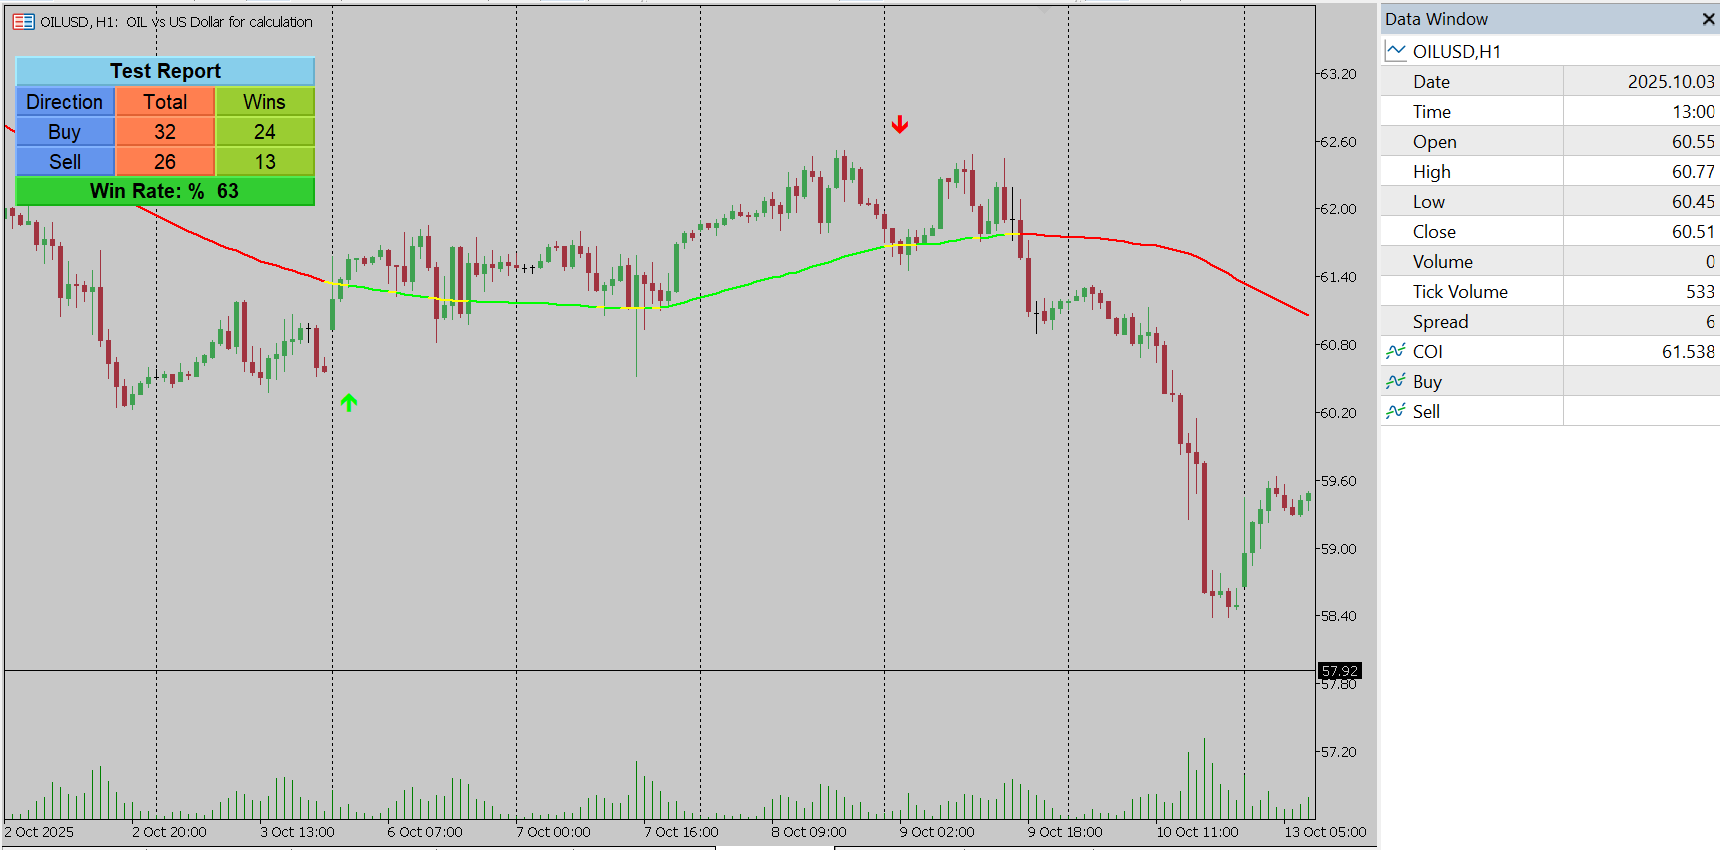
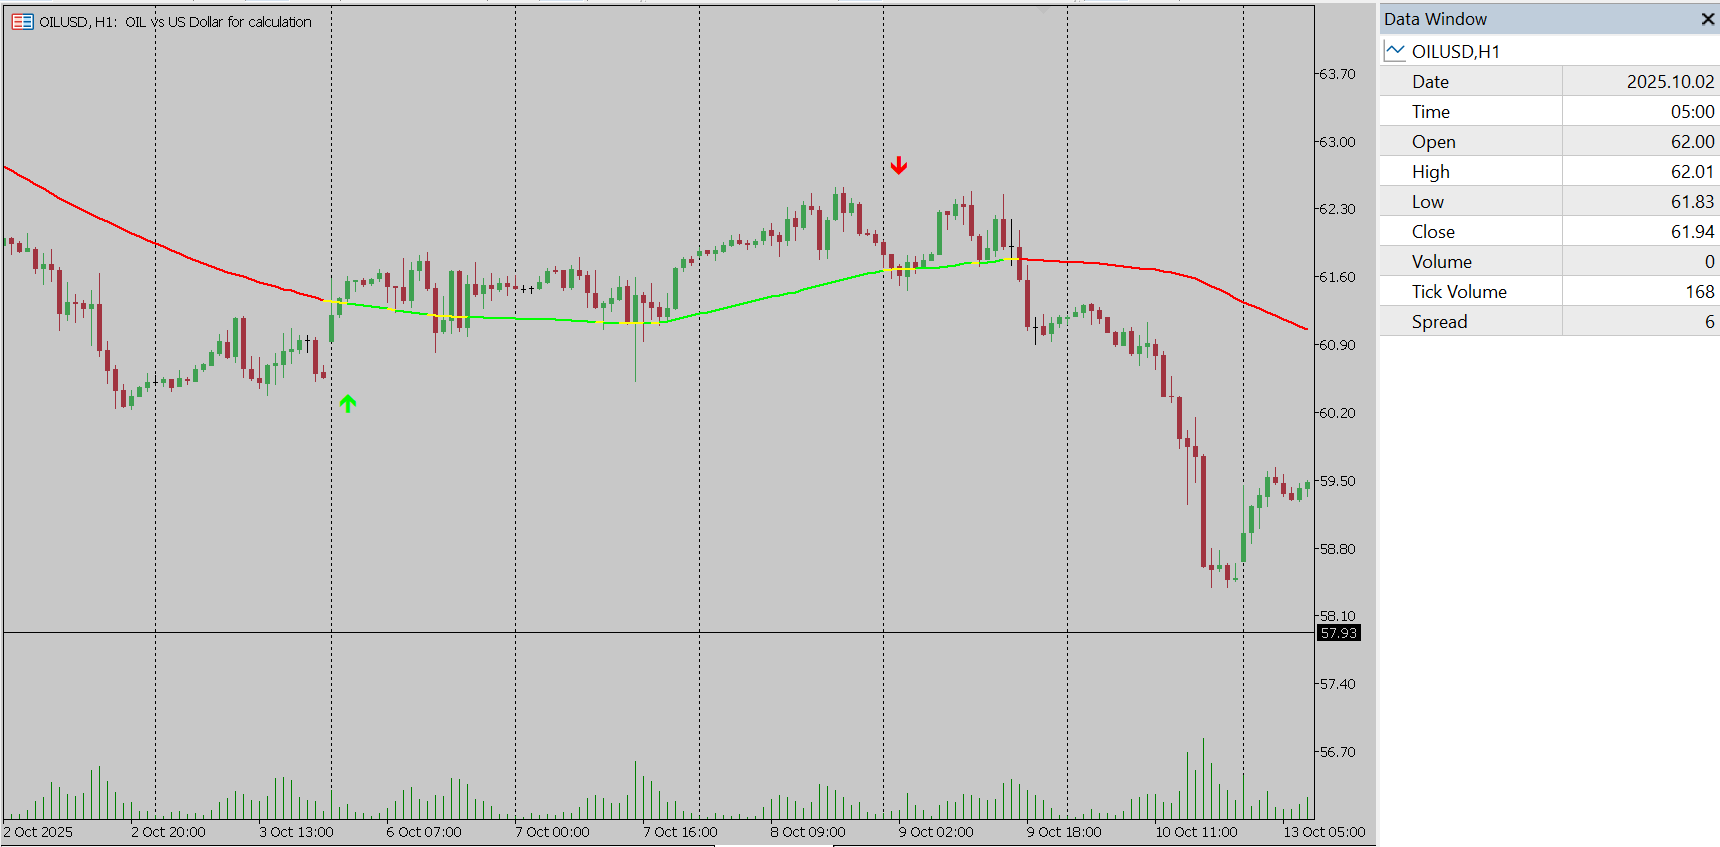
In short: the Crude Oil Buy/Sell indicator for MetaTrader 5 is a 3-minute scalping tool for oil. It places B and S labels on the chart when RSI momentum, price position relative to a 70-period SMA, and candle strength all agree, and adds separate markers for possible reversals.
Why a dedicated crude oil indicator?
Oil moves fast around inventory reports, geopolitical news and session opens, and on a 3-minute chart a single weak candle can trigger a false signal on a simple indicator. This tool is built around that problem: it asks for three separate confirmations before it prints a label, and it is tuned for the pace of oil on short timeframes.
The three conditions behind every signal
- RSI momentum. RSI detects overbought and oversold zones. The recommended thresholds are 80 for the high and 20 for the low, more extreme than the usual 70/30, so that the indicator reacts to stretched moves rather than ordinary swings.
- SMA position. A 70-period SMA confirms whether price is trading above or below its short-term average trend, so signals line up with the direction of the move.
- Candle strength. The indicator compares each candle’s body with its full range. A strong body means the move had real momentum behind it; a candle that is mostly wicks does not qualify.
When upward conditions align you get a B label; when downward pressure is confirmed you get an S label. Bars are also colored dynamically according to the current market state, so you can read the bias at a glance.
Reversal markers
Separate reversal markers appear when RSI and price patterns suggest a move is exhausted. Treat them as a prompt to tighten a stop, take profit on an open trade, or wait for further confirmation. They are not a substitute for a trading plan.
Recommended setup
- Timeframe: 3 minutes.
- Instruments: crude oil (CL, USOIL or Brent, depending on your broker’s naming).
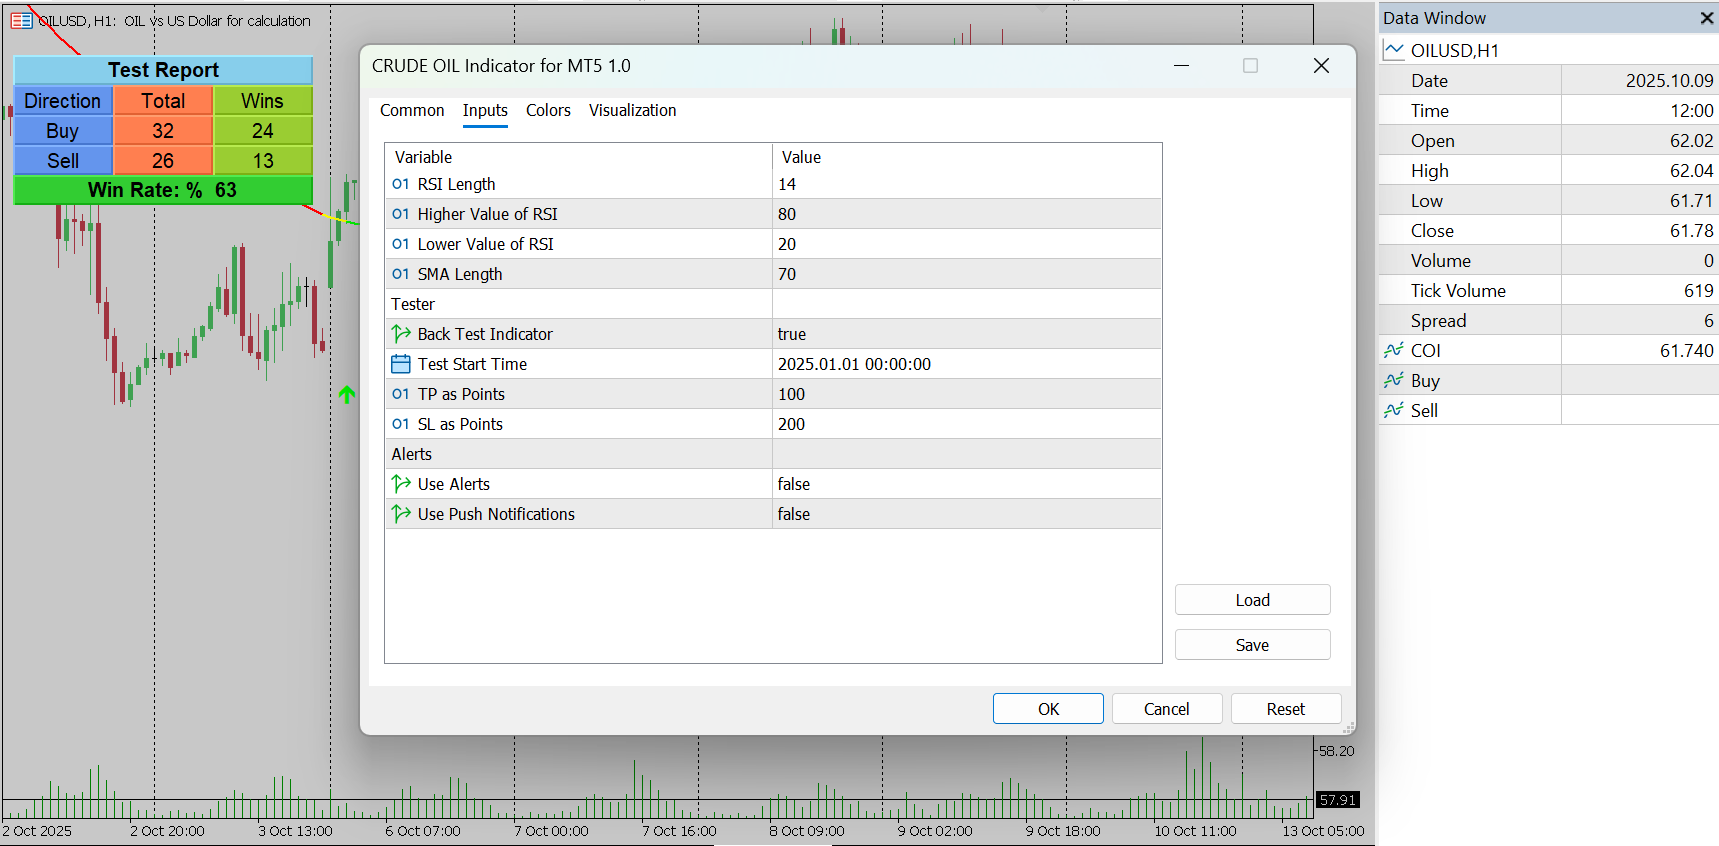
- Parameters: RSI Length 14, SMA Length 70, RSI High 80, RSI Low 20.
- When to trade it: active market hours. The guidelines recommend avoiding signals during low-volatility periods.
If your broker’s oil contract behaves differently, for example with wider spreads or a different session schedule, adjust the RSI and SMA parameters and compare the results on your own chart history before trading live.
A practical way to use it
- Use the indicator as confirmation, not as the entry reason by itself. Look at where price sits relative to recent highs, lows and key levels first.
- Take B and S signals that agree with that bigger picture, and be selective with signals against it.
- Treat reversal markers as warnings on open trades.
- Set stops and position size for oil’s volatility before you act on any label.
For the wider context of trading oil volatility, read how to trade a crude oil supply shock on MT5. For a structure-based way to confirm entries, see our Market Structure Break & Order Block indicator.
Alerts
The indicator can alert you to buy signals, sell signals, upward and downward reversals, and general direction changes, so you don’t have to watch a 3-minute chart continuously.
Frequently asked questions
Which timeframe and symbols is it designed for?
The 3-minute chart on crude oil instruments such as CL, USOIL or Brent. It can be attached to any symbol, but it is tuned for oil.
What are the recommended settings?
RSI Length 14, SMA Length 70, RSI High 80 and RSI Low 20. These are intended for scalping and short-term trading during active market hours.
What do the B and S labels mean?
B marks a buy signal and S marks a sell signal. They appear only when the RSI condition, the SMA position and the candle-strength check all agree.
What are the reversal markers?
Extra markers that flag a possible turning point when RSI and price behavior suggest the move is exhausted. They are warnings to review the trade, not automatic entries.
Which alerts are available?
Alerts for buy signals, sell signals, upward and downward reversals, and general direction changes.
Can I use it as a standalone system?
No. It works best as confirmation alongside market structure or volume analysis, with proper risk management. It is best avoided in low-volatility periods.
Is there a free demo?
Yes. Download the free demo from the MQL5 Market and run it in the MetaTrader 5 Strategy Tester before buying.
The Crude Oil Buy/Sell indicator is an analysis tool and does not guarantee trading results.
Ready to try Crude Oil Indicator for MT5?
Download it from the MQL5 Market and attach it to your MetaTrader 5 chart in minutes.
Want it customized or need something similar? Request a free quoteTrading involves risk. Our indicators are analysis tools for educational and informational purposes and do not constitute financial advice. Read our Disclaimer.
More indicators

TRAMA Indicator for MT5
TRAMA, the Trend Regularity Adaptive Moving Average for MT5, adapts to trend strength to follow price closely in trends and stay flat in ranges.
View details →
Nadaraya Watson Envelope Indicator for MT5
A Nadaraya-Watson envelope for MetaTrader 5 built with kernel regression, plotting dynamic bands to spot overextended prices and potential reversals.
View details →
Market Structure CHoCH BOS
Identify changes of character (CHoCH) and breaks of structure (BOS) in MetaTrader 5 with this fractal-based market structure indicator.
View details →