

When markets move the way they moved last week, the difference between a profitable and a losing week comes down to a single factor: did you identify the trend early enough to ride it, or did you enter late and get trapped in the reversal? The gap between those two outcomes is not luck. It is trend identification speed — and that is precisely what the RMI Trend Sniper Indicator for MT5 is engineered to solve.
The RMI (Relative Momentum Index) Trend Sniper combines the smoothness of a momentum oscillator with the directional clarity of a trend filter — giving you early entry signals at the start of new trends while filtering out the choppy, sideways noise that traps most momentum traders. In a week when USD/JPY moved over 400 pips in a single session on BoJ intervention, and gold broke a historic threshold, the ability to get positioned at the start of the move — not after it — is worth more than any after-the-fact analysis.
01What Makes the RMI Different from Standard RSI
Most traders are familiar with the Relative Strength Index. The RMI is its more sophisticated successor — designed to address RSI’s core weaknesses while preserving its interpretive simplicity.
Standard RSI compares the current close to a single previous close, creating a measurement that is sensitive to individual candle anomalies and prone to generating overbought/oversold readings that persist through strong trends. The result is an indicator that tells you a trend is “overbought” while price continues climbing for another 200 pips — a problem every experienced trader has encountered.
The RMI replaces the single-close comparison with a momentum lookback period — comparing the current close to the close from N periods ago rather than the immediately previous candle. This single modification produces dramatically smoother readings, reduces false divergence signals, and — critically — allows the indicator to stay aligned with trends rather than fighting them.
Smoother Readings
The momentum lookback period averages out single-candle spikes that cause RSI whipsaws. During last week’s BoJ intervention, the RMI stayed short on USD/JPY while standard RSI bounced into oversold territory and prematurely signalled a reversal.
Trend Alignment
The Trend Sniper layer on top of the RMI keeps the indicator directionally locked until the trend genuinely reverses. This is what allows it to stay long on gold through the entire move from $4,600 to $5,000 without triggering premature exit signals.
Early Entry Signals
By detecting momentum shifts before they fully manifest in price, the RMI Trend Sniper fires its signal at the beginning of a new trend leg — not after the move has already delivered most of its pips to those who entered earlier.
02Last Week Through the RMI Lens — Four Major Trends
The week of April 27–May 1 gave traders four distinct high-quality trend opportunities. Here is how the RMI Trend Sniper would have read each one.
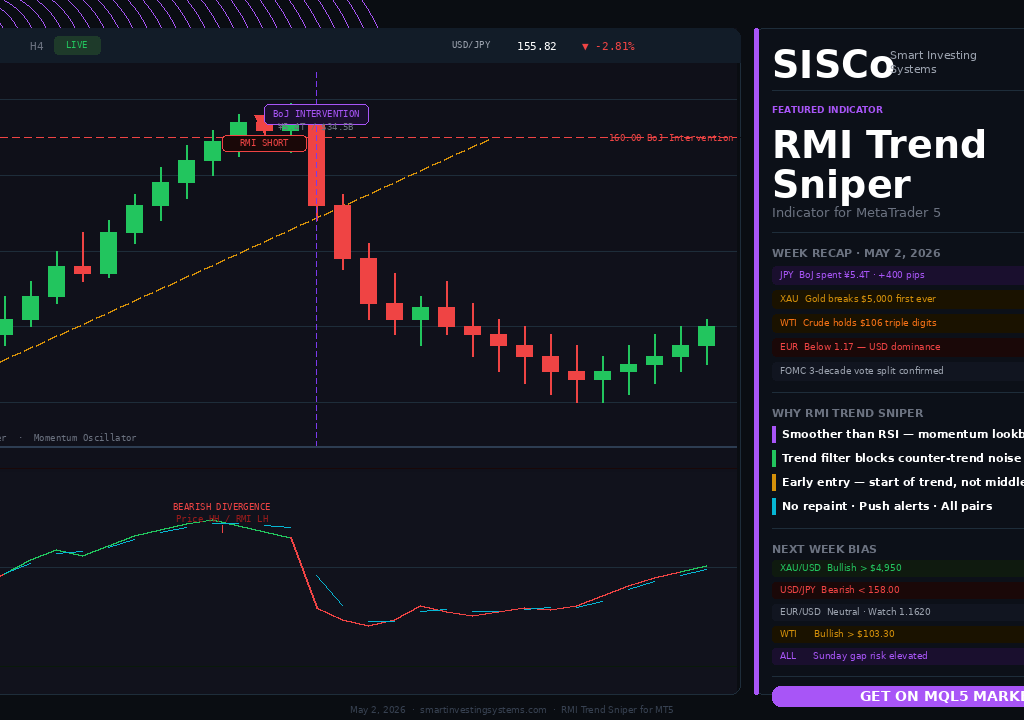
USD/JPY — Intervention Crash
The RMI was already showing bearish divergence on USD/JPY as it pressed 160.40 — momentum was weakening while price pushed higher. When intervention hit and the pair crashed over 400 pips, the Trend Sniper had already shifted to a short signal. Traders following the indicator were positioned, not reacting.
Gold — Historic $5,000 Break
The RMI maintained a bullish trend signal through gold’s entire ascent, never triggering the premature reversal signals that standard RSI would have generated as gold pushed through “overbought” territory at $4,700, $4,800, $4,900 and then $5,000.
Crude Oil — Triple-Digit Hold
WTI broke above $100 and held. The RMI’s early bull signal fired at the $98 retest after the initial break, positioning trend traders ahead of the run toward $106 and beyond. Exxon’s CEO confirmed the market hasn’t seen the full supply disruption impact yet.
EUR/USD — Downside Pressure
EUR/USD slipped below 1.17 under the weight of weak Eurozone growth and US dollar strength from the FOMC’s hawkish split vote. The RMI generated a clean bear signal at the break below 1.1700 with a retest to 1.1720 that confirmed the downside continuation.
03How the Trend Sniper Signal Works
The RMI Trend Sniper is not a simple overbought/oversold indicator. Its signal logic operates on two layers simultaneously — the underlying RMI momentum reading, and a trend filter that determines whether momentum is aligned with the directional structure of the market.
- →RMI crosses above its signal line from below the midpoint
- →Trend filter confirms price is in a bullish structure on this timeframe
- →Momentum is accelerating — RMI slope is positive and increasing
- →Signal arrow fires on candle close — no repainting
- →RMI crosses below its signal line from above the midpoint
- →Trend filter confirms price is in a bearish structure on this timeframe
- →Momentum is accelerating downward — RMI slope is negative and steepening
- →Signal arrow fires on candle close — confirmed, not intrabar
The dual-layer logic is what sets the Trend Sniper apart from basic RMI implementations. Without the trend filter, an RMI crossover in a ranging market generates signals in both directions with roughly equal frequency — most of which are false starts. The trend filter eliminates crossovers that occur against the prevailing structure, dramatically improving signal quality without reducing frequency in genuinely trending markets.
04Configuring the RMI Trend Sniper for Next Week’s Market
The market opening next week faces significant uncertainty: Iran war reignition risk, gold at historic highs, USD/JPY post-intervention positioning, and Kevin Warsh’s incoming Fed Chair tenure beginning in mid-May. Here is how to configure the indicator for this environment.
| Parameter | Function | Recommended for Current Conditions |
|---|---|---|
| RMI Period | The primary smoothing period. Lower values = faster signals with more noise; higher values = slower but cleaner signals. | 12–14 for H1 trending markets; 8–10 for H4 swing trades this week |
| Momentum Lookback | How far back the RMI compares closes. This is the key differentiator from RSI. Higher lookback = smoother, more trend-aligned readings. | 4–6 for volatile, fast-moving markets like current JPY and Gold |
| Trend Filter Period | The period of the trend filter that determines whether signals are with or against the prevailing structure. | 50-period for H1; 20-period for H4 — keep it longer in high-volatility weeks |
| Signal Sensitivity | Determines how far the RMI must cross its signal line before an arrow fires. Higher sensitivity = more signals; lower = fewer but higher quality. | Reduce sensitivity this week — geopolitical news creates many false crossovers |
| Alert Type | Popup, push notification, or email alert when a signal fires. | Enable push notifications — weekend gap opens and Monday opens need instant alerts |
05Weekend Preparation — How to Set Up for Next Week
Saturday and Sunday are not rest days for a prepared trader. They are the most valuable analysis window of the week — when the market is closed, you can think clearly without the pressure of live prices. Here is your RMI Trend Sniper preparation framework for the week ahead.
Review the weekly candle close on your key pairs
The weekly candle close is the highest-conviction structural signal available. Pull up USD/JPY, XAU/USD, EUR/USD, and WTI on the weekly chart. Note where the RMI Trend Sniper is reading right now — bullish, bearish, or neutral. This is your directional bias for the entire week ahead. Do not trade against it unless a major news event changes the macro picture.
Mark the key levels where signals would be highest-probability
Identify the support and resistance zones on H4 where the next RMI Trend Sniper signal would be most meaningful. For gold, that is the $4,950–$5,000 retest zone. For USD/JPY, the $155–157 post-intervention consolidation range. For EUR/USD, the 1.1620 key support that OANDA identified as the next major battleground.
Check the economic calendar for next week’s volatility windows
The week of May 4–8 includes the US ISM Services PMI, several Fed speaker appearances including Powell’s first post-FOMC comments, and ongoing Hormuz geopolitical risk. Disable or widen your signal sensitivity during the highest-impact windows — the indicator’s signal quality drops when news-driven volatility creates non-structural momentum crossovers.
Configure your alerts before Sunday night
The Asian session open on Sunday evening (20:00–21:00 GMT) is when the first market reaction to weekend geopolitical developments occurs. This week, with Iran war reignition risk elevated after Trump’s failed peace deal, the Sunday open could be sharply risk-off. Set your push notification alerts on your key pairs before Sunday evening so the indicator can alert you to the first directional signal of the week.
Define your risk parameters before the week begins
In a high-uncertainty week like the one ahead, position sizing is as important as signal quality. Decide your maximum risk per trade as a percentage of account — and stick to it regardless of how strong the RMI signal looks. Geopolitical gap risk is real, and the indicator cannot price in a Sunday night Hormuz headline. Risk management is the last line of defence that no indicator can replace.
06Why Momentum Indicators Fail in Intervention Markets — and How RMI Handles It
The BoJ’s $34.5 billion intervention last Thursday is a masterclass in why conventional momentum indicators break down during policy-driven events. When USD/JPY was at 160.40 and intervention hit, standard RSI was deep in “overbought” territory — but had been there for days without price reversing. Most RSI-based systems were either already short (and got stopped out before the real move) or were not positioned at all.
Standard RSI gives premature overbought/oversold signals in trending markets. USD/JPY was “overbought” on RSI-14 for over a week before the intervention. Traders shorting on RSI overbought alone were repeatedly stopped out. The RMI’s momentum lookback prevents this by requiring genuine momentum deceleration — not just an elevated reading — before generating a reversal signal.
Central bank intervention creates non-structural momentum spikes. When $34.5 billion hits the market in a short window, the price move is genuine but the momentum signal is artificially amplified. The RMI Trend Sniper’s trend filter helps by requiring that the post-intervention structure confirms the new direction on candle close — preventing entry on the spike itself and waiting for the structural confirmation.
Divergence signals are unreliable in intervention-driven moves. During the USD/JPY crash, many traders saw RSI divergence on lower timeframes and tried to fade the move — only to find the intervention had more firepower than any divergence signal could anticipate. Use RMI divergence as a warning, not a trigger, in weeks with confirmed or threatened central bank action.
Weekend gap risk cannot be signalled in advance. No indicator — including the RMI Trend Sniper — can tell you what a Sunday night gap will do to your open positions. The single most important risk management action you can take this weekend is to close or reduce any positions you would not be comfortable holding through a 150+ pip gap open, and set hard stop losses on everything else before Sunday evening.
07The Week Ahead — RMI Trend Sniper Bias for Key Markets
Based on the weekly candle closes and the current RMI Trend Sniper readings across the major markets, here is the directional bias entering the week of May 4–8.
Catch the Next Big Trend Before It Runs Without You
The RMI Trend Sniper for MT5 fires early-entry signals at the start of new trend legs — combining RMI momentum with a structural trend filter to eliminate the noise and keep you aligned with the move that matters. No repainting. Push notification alerts. Works on all pairs and timeframes.
↗Conclusion
The week of April 27–May 1 handed traders four exceptional trend opportunities — the yen intervention crash, gold’s historic $5,000 break, crude oil holding triple digits, and EUR/USD’s breakdown below 1.17. Every one of these was a momentum trend. Every one required an indicator capable of identifying the trend early and staying with it through the noise. That is exactly what the RMI Trend Sniper is built to do.
Next week will bring more trends. Gold will move. The yen will react to every Iran headline. Crude will respond to every Hormuz development. The question is not whether there will be opportunities — it is whether you are positioned at the start of them or chasing them from behind. Set up the RMI Trend Sniper this weekend and go into next week ready.