Cumulative Delta Volume Indicator for MT5
The CDV indicator for MetaTrader 5 measures the balance of buying and selling volume to reveal market sentiment and trend strength.
- MetaTrader 5
- Works on VPS
- Lifetime support
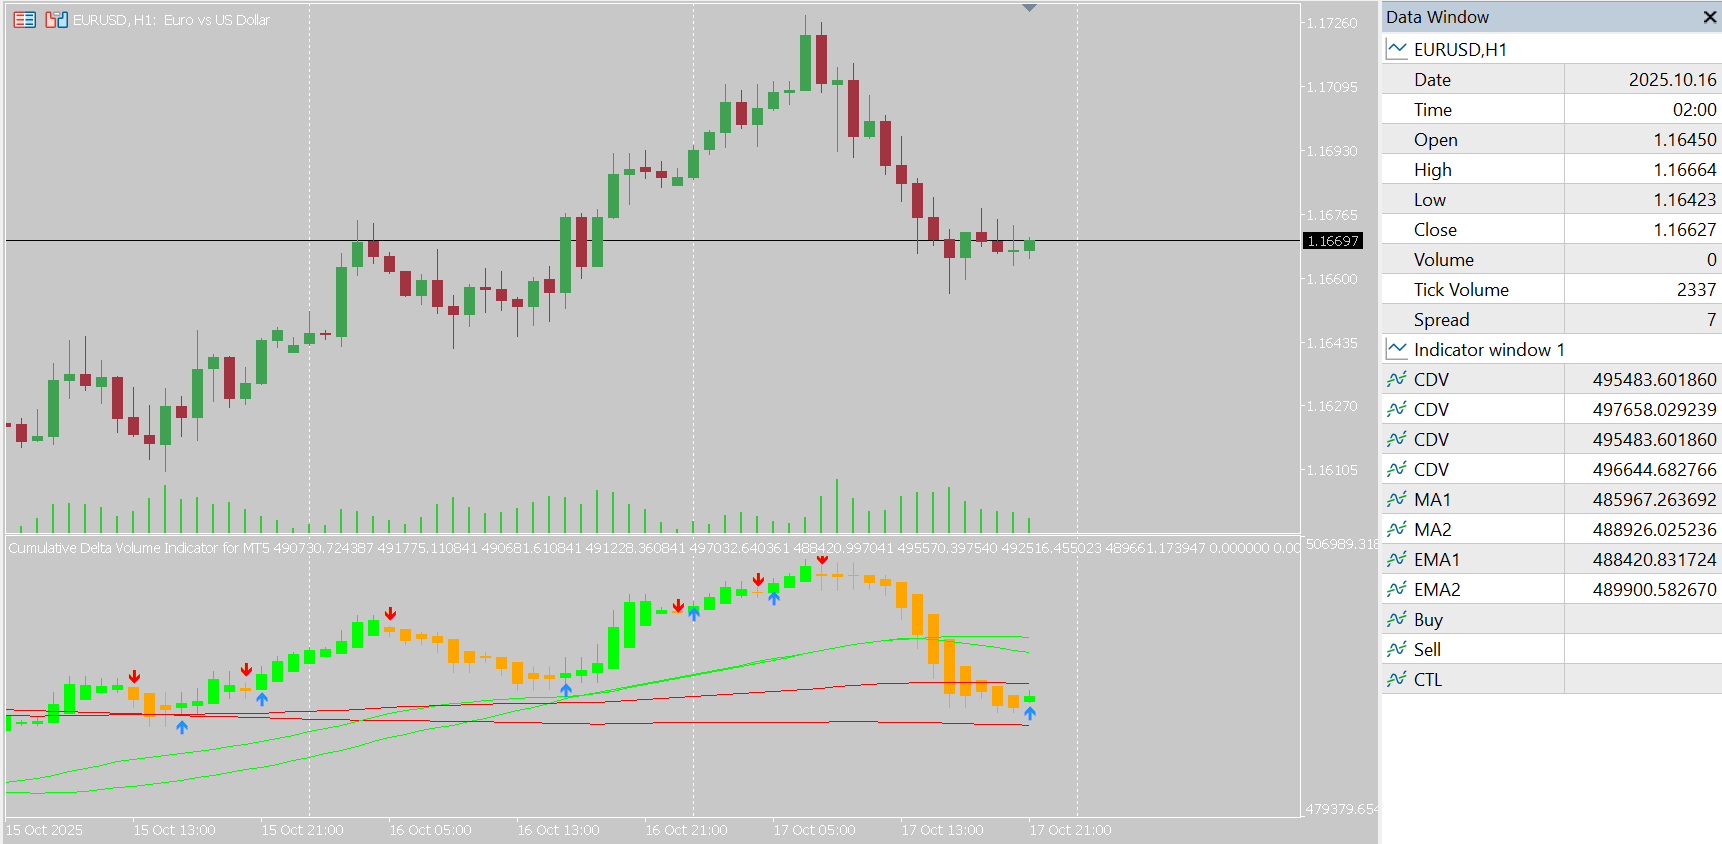
About Cumulative Delta Volume Indicator for MT5
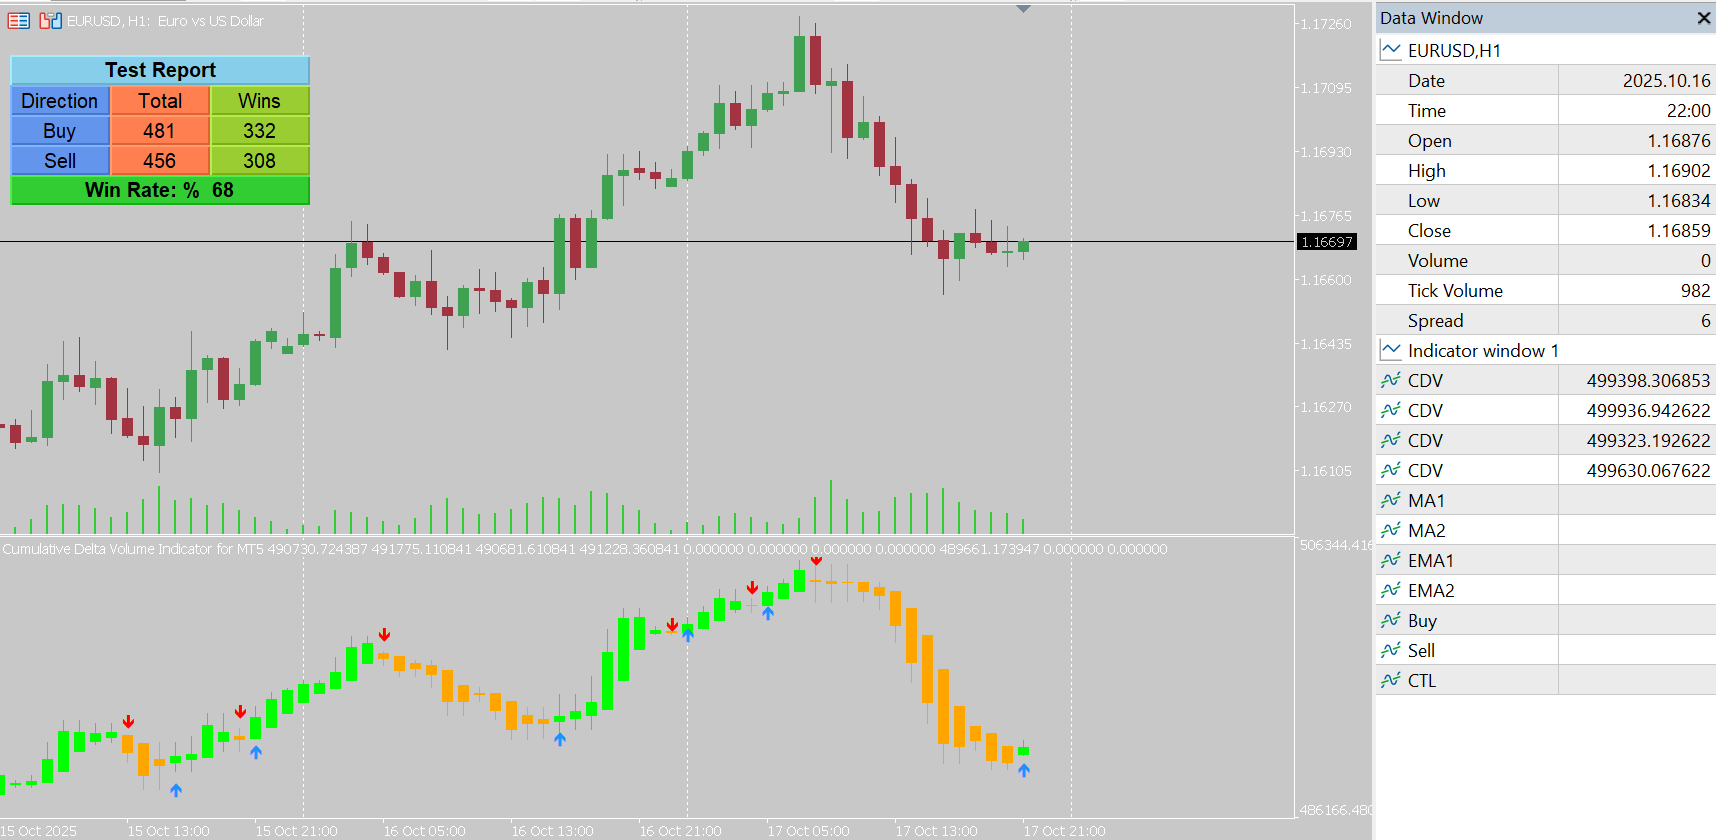
In short: the Cumulative Delta Volume (CDV) indicator for MetaTrader 5 estimates buying and selling volume on each bar and adds up the difference over time, showing whether buyers or sellers are in control and whether a trend has real participation behind it.
From volume to delta
Total volume tells you how much traded, but not who was pushing. Delta tries to answer that: for each bar the indicator estimates how much of the volume belongs to buying activity and how much to selling, and the delta is the difference. Cumulative delta then adds those differences bar after bar, creating a running line of net buying or selling pressure.
- A rising CDV line means buying has been dominating.
- A falling CDV line means selling has been dominating.
For the reasoning behind this approach, see our explainer What is cumulative delta volume and why price alone isn’t enough.
Two ways to display it
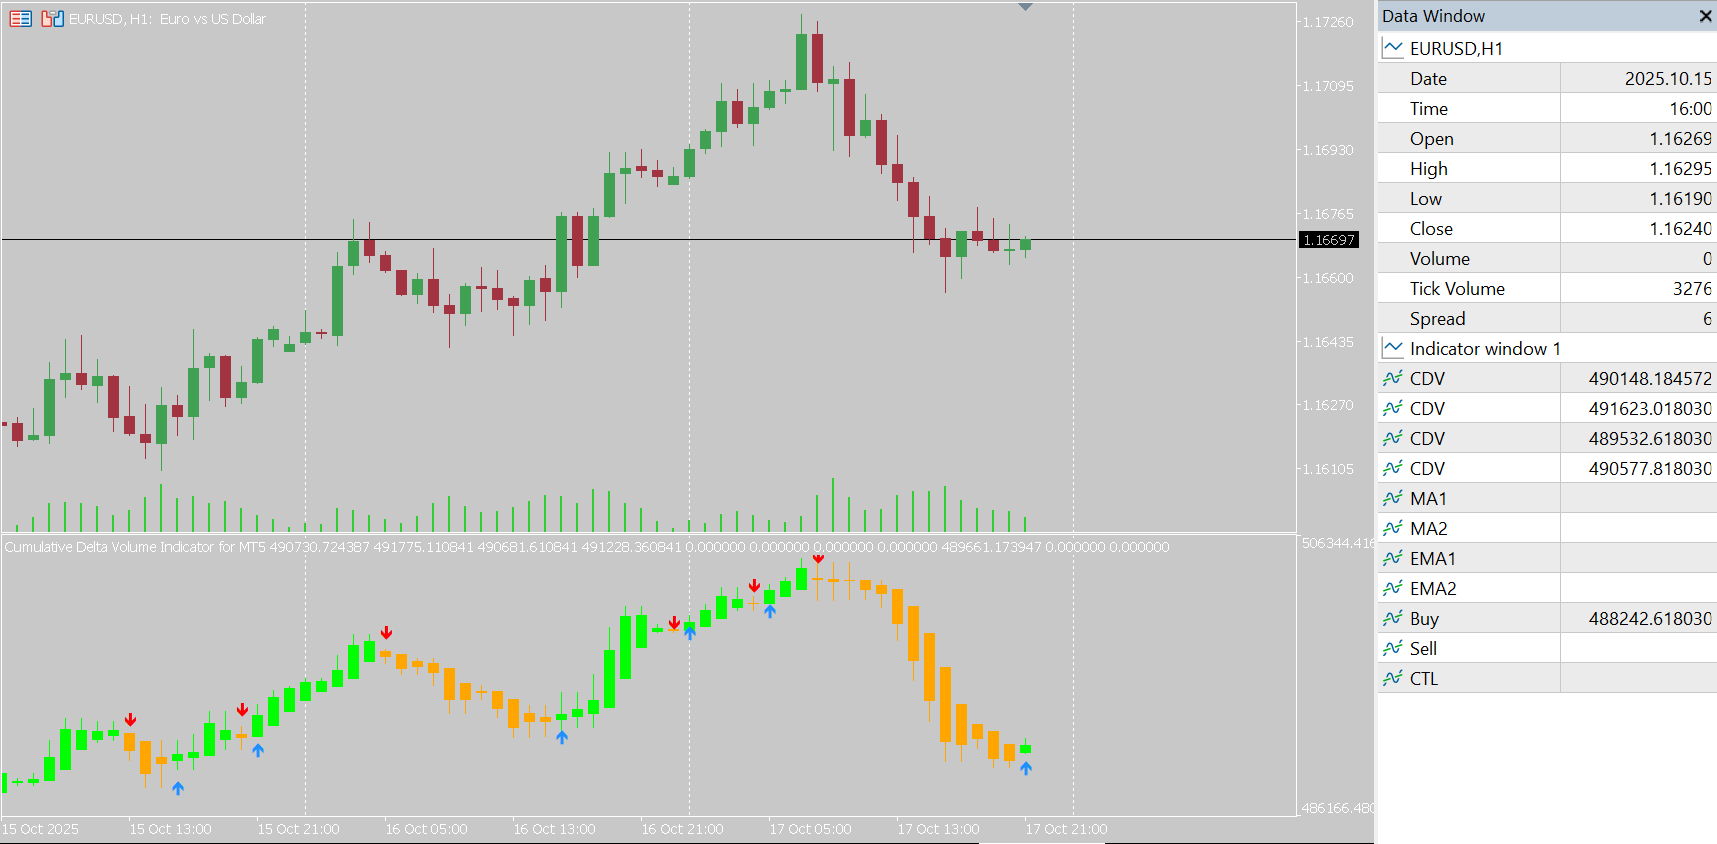
- Candle mode shows the cumulative delta as candles, so you can read it like a price chart: bodies, wicks and shifts in direction.
- Line mode shows a single cumulative delta line, which is cleaner for spotting trends and divergences.
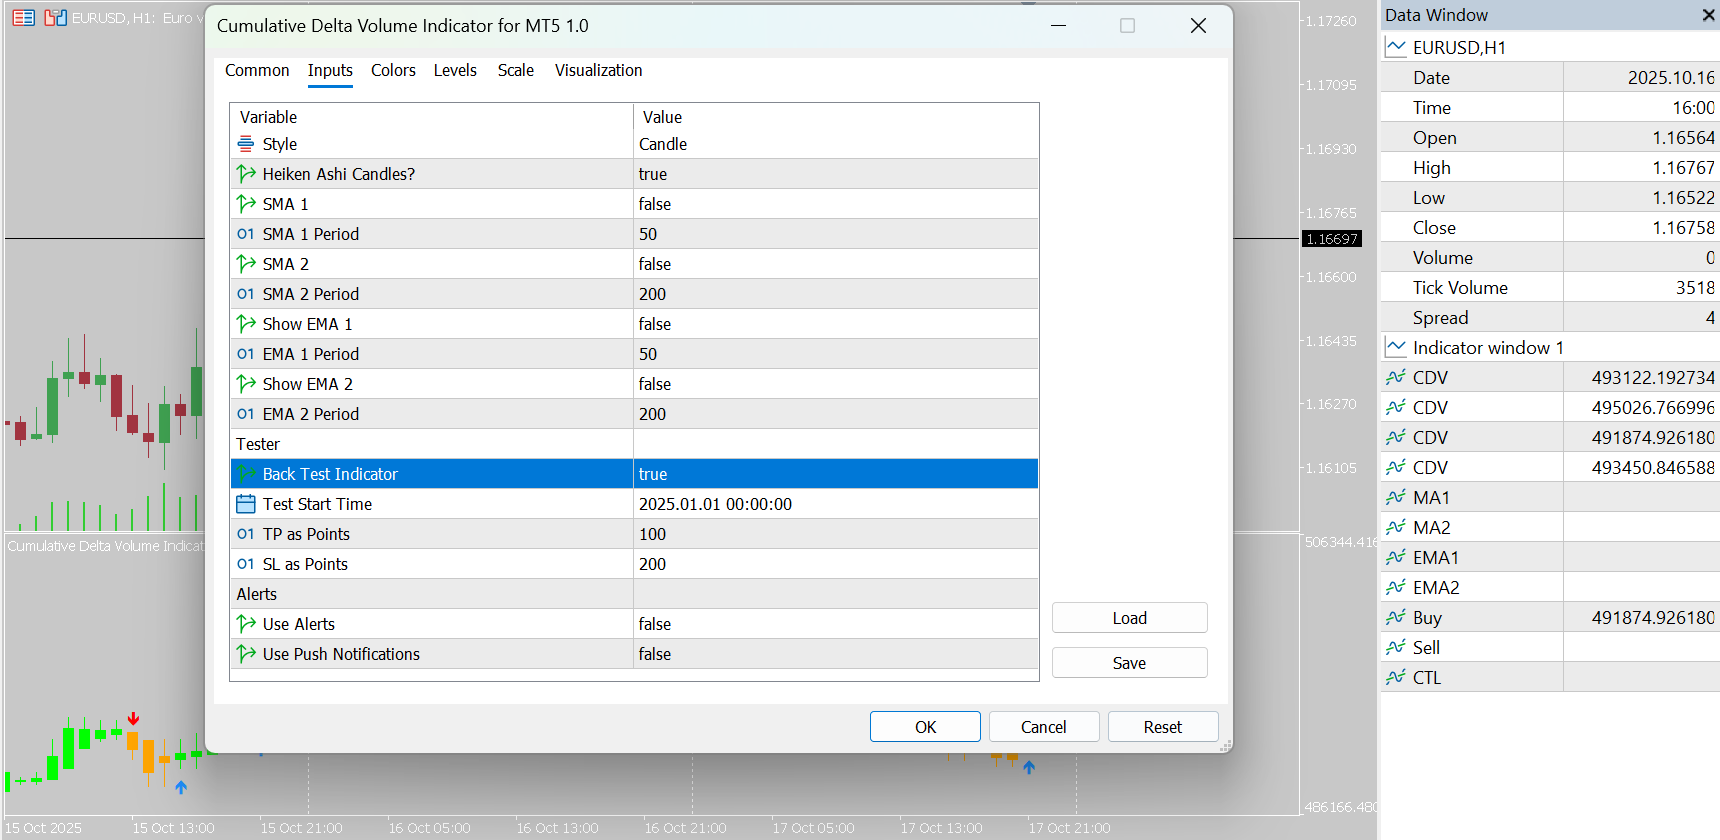
You can also turn on Heikin Ashi smoothing to reduce noise, and add SMA and EMA overlays to see CDV trend direction and use the averages as dynamic support and resistance for the delta itself.
How to use CDV
- Trend confirmation. In an uptrend, you want CDV to rise with price. That shows the move has buying behind it.
- Divergence. If price makes a new high but CDV does not, the push may be running out of participation. The same logic applies at lows in reverse.
- Control shifts. A CDV that turns and crosses its moving average can show that control is moving from one side to the other.
- Confirmation with other tools. Use CDV together with price action and volume profile analysis to confirm institutional activity.
Settings
- Style – Candle or Line mode.
- Heikin Ashi Candles – optional smoothing of CDV candles.
- SMA/EMA Settings – periods and colors of the overlays.
- Color settings – candle body, border and wick colors.
Limits to keep in mind
Delta is an estimate built from the volume data available for each bar, so treat it as supporting evidence rather than as exact order flow. A divergence is a warning, not a timing signal, and price can keep going for a while before the volume story shows up. Always combine CDV with price structure.
It pairs naturally with structure tools such as the Market Structure CHoCH/BOS indicator.
Frequently asked questions
What is cumulative delta volume?
Delta is the difference between buying and selling volume on a bar. Cumulative delta adds those differences over time, producing a running measure of whether buyers or sellers have been more aggressive.
What does a rising or falling CDV mean?
A rising CDV suggests buyers are dominant and may support an uptrend continuing. A falling CDV shows selling dominance and may mean a downtrend continuing or a trend reversal.
How do I spot divergences?
Compare CDV with price. If price makes a new high but CDV does not follow, buying participation may be weakening. The same applies in reverse for lows. Use this together with price action and volume profile analysis.
What display options are there?
A Candle view and a Line view, optional Heikin Ashi smoothing, SMA and EMA overlays, and fully adjustable colors.
Which markets and timeframes does it work on?
All markets and all timeframes.
Is there a free demo?
Yes. Download the free demo from the MQL5 Market and run it in the MetaTrader 5 Strategy Tester before buying.
Cumulative Delta Volume is an analysis tool and does not guarantee trading results.
Ready to try Cumulative Delta Volume Indicator for MT5?
Download it from the MQL5 Market and attach it to your MetaTrader 5 chart in minutes.
Want it customized or need something similar? Request a free quoteTrading involves risk. Our indicators are analysis tools for educational and informational purposes and do not constitute financial advice. Read our Disclaimer.
More indicators

Follow Line Indicator for MT5
Follow Line is a non-repainting trend-following indicator for MetaTrader 5 that uses Bollinger Bands and ATR filtering to generate buy and sell signals.
View details →
Better RSI With Tester
Better RSI for MetaTrader 5 enhances the classic RSI with clearer visuals, cycle detection and a built-in tester to evaluate signals.
View details →
MACD Leader Indicator for MT5
MACD Leader reduces the lag of the traditional MACD to give earlier trend and momentum signals in MetaTrader 5. How it works, settings and…
View details →