
Trendlines are the oldest tool in technical analysis. They are also one of the most inconsistently applied. The challenge has never been drawing the line — it is knowing the moment the line is no longer valid. Manual trendlines do not alert you. They do not redraw when price evolves. And they cannot tell you whether a break is genuine or a liquidity sweep designed to trap breakout traders before reversing.
The Trendlines with Breaks Indicator for MT5 solves exactly this problem. It automatically plots dynamic support and resistance trendlines directly on your chart, detects genuine structural breaks in real time, and alerts you the moment a valid break occurs — so you can act on the move rather than react to it after the fact. On a day like today, when gold just broke its first major support in three weeks and EUR/USD is carving out a new lower range, this is precisely the kind of tool that separates planned trades from reactive ones.
01Why Manual Trendlines Keep Failing You
Retail traders draw trendlines. Institutional traders break them — on purpose. Understanding this dynamic is the first step to using trendlines profitably rather than as a source of repeated losses.
When a trendline has been visible on a chart for an extended period, it attracts two types of participants: traders who buy or sell the line on touch, and traders who place stop losses just beyond the line. Market makers know exactly where both groups are positioned. The result is predictable: price sweeps through the trendline, triggers the stops, reverses, and leaves both groups trapped on the wrong side of a move they saw coming.
The solution is not to stop using trendlines — it is to automate their detection and add a confirmation filter to break signals. That is what the Trendlines with Breaks indicator delivers.
Automatic Detection
The indicator identifies valid swing highs and lows and connects them into trendlines automatically — removing subjectivity from line placement and ensuring you are trading the same lines the algorithm is tracking.
Break Detection
When price closes convincingly beyond a trendline, the indicator flags the break immediately — with a visual marker on the chart and an optional alert. No more second-guessing whether a wick counts as a break.
Real-Time Alerts
Popup and push notification alerts fire the moment a valid break is confirmed — so you do not need to watch the chart all session. The alert comes to you, not the other way around.
02Today’s Market Through the Lens of Trendline Breaks
April 30, 2026 is a textbook example of why trendline break detection matters more than trendline drawing. Three of the most-watched levels in global markets broke today — each with its own structural story.
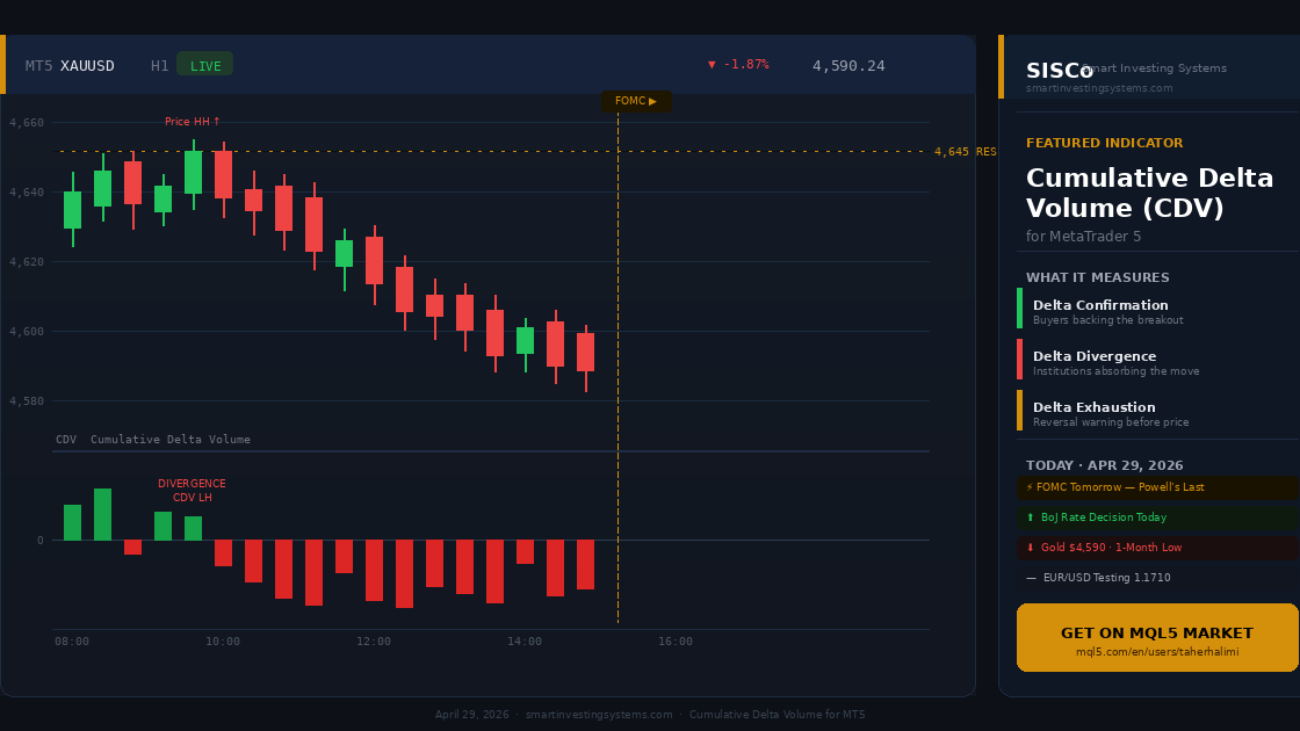
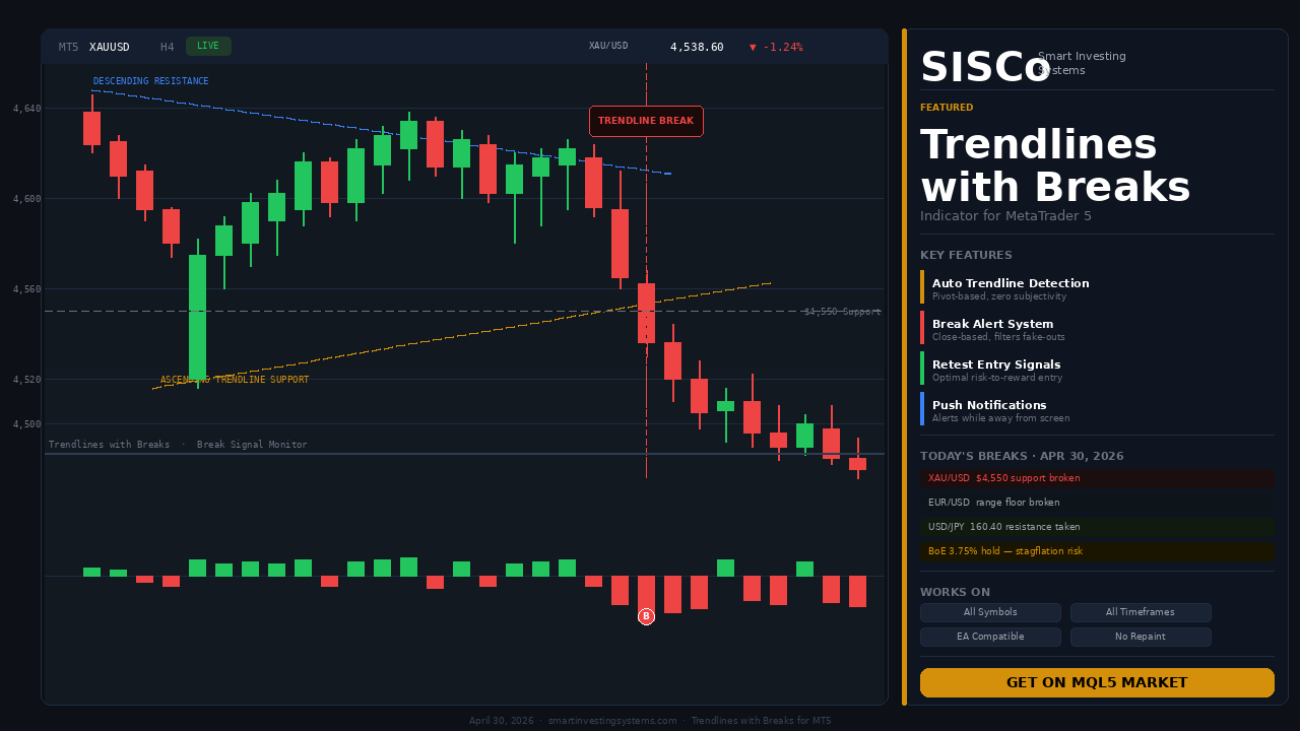
Gold · $4,550 Break
XAU/USD broke its three-week ascending trendline support at $4,550, with the Forex Factory community already tracking targets of $4,515 and $4,300. Powell’s cautious tone at the FOMC triggered profit-taking that had been building for days. Traders watching the trendline manually missed the entry by 20–30 pips. A break alert would have fired at candle close.
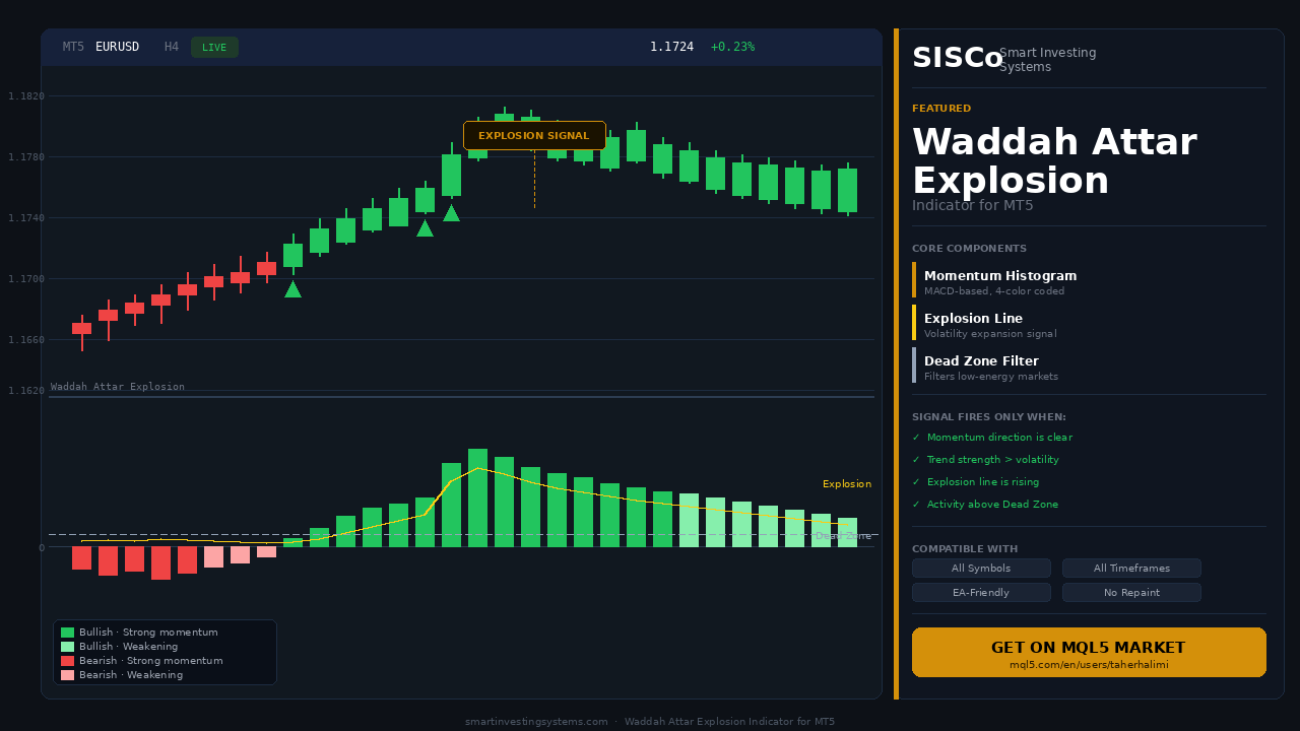
EUR/USD · Range Lower Boundary
EUR/USD broke its short-term consolidation base as Trump’s 15–20% EU tariff announcement hit the wires. The pair’s descending trendline from 1.1820 was already drawing lower highs — a textbook descending channel. The break of the range floor confirmed the next leg lower toward 1.1660 support.
USD/JPY · 160 Resistance Break
USD/JPY pushed through the 160.00 resistance trendline with no verbal intervention from Japanese officials. The level is a well-documented intervention threshold — but without a confirmed BoJ response, the break is trending. Trendline break detection on the H1 alerted at the confirmed close above 160.40.
All three of these were trendline breaks visible to any chart reader — but only those who had automated break detection received a clean, unambiguous entry signal without having to manually monitor three separate charts through an event-dense session.
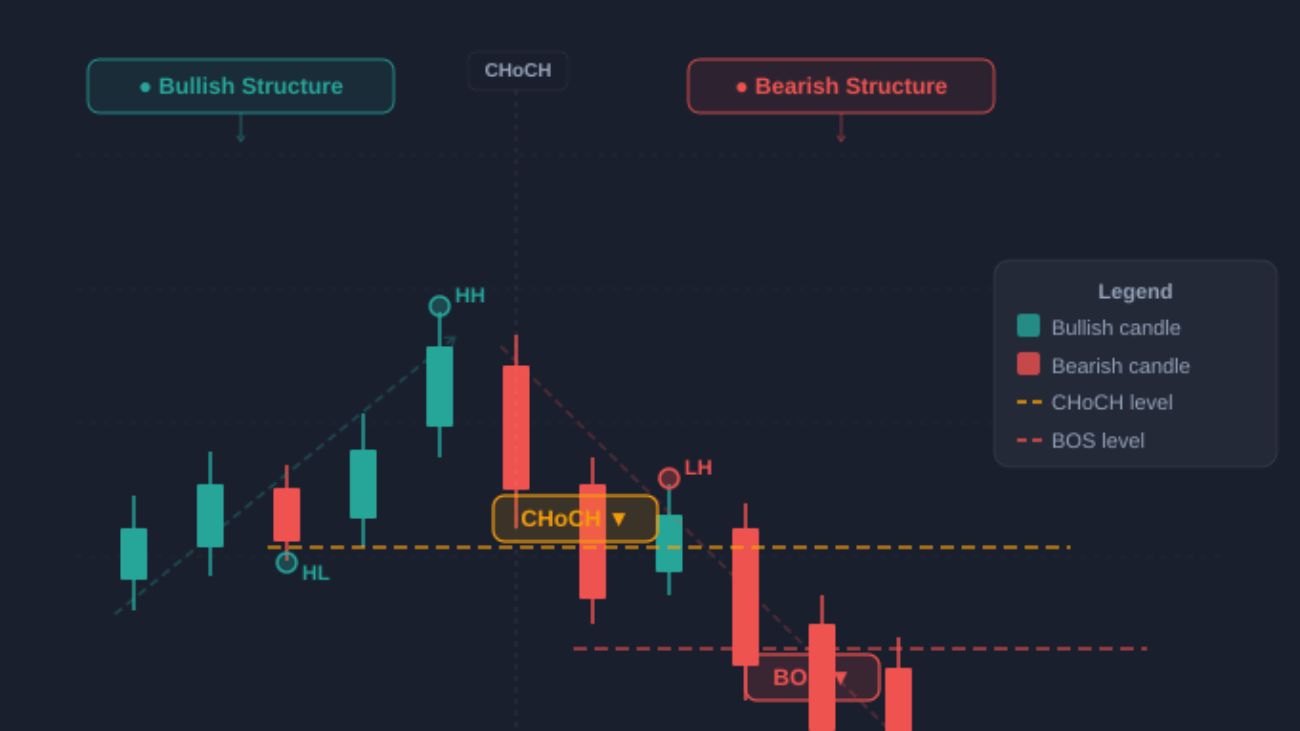
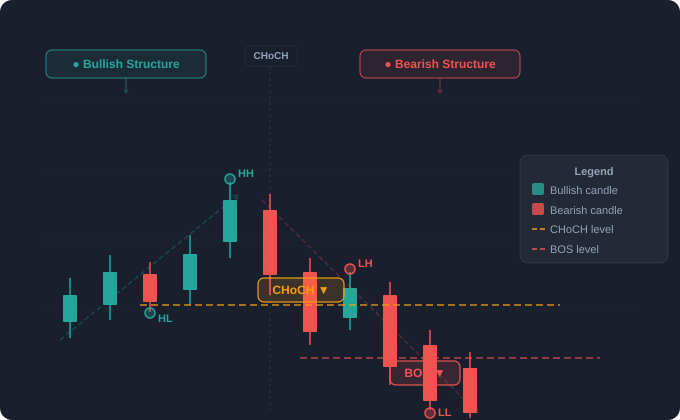
03The Anatomy of a Valid Break vs. a Fake-Out
The most important skill in trendline trading is not drawing the line — it is distinguishing a real break from a stop hunt. The Trendlines with Breaks indicator is built around candle-close confirmation, which filters the majority of intrabar spikes that catch manual traders off-guard.
- →Price closes a full candle body above the descending trendline
- →Volume (or tick delta) is elevated on the break candle
- →Price retests the broken trendline as new support on next candle
- →Retest candle closes above the line — entry confirmation
- →Wick penetrates the line but candle body closes below it
- →Break occurs on low volume or narrow-range candle
- →Price immediately returns inside the trendline channel
- →No retest — price just drifts back without momentum
The indicator’s close-based break detection eliminates the majority of fake-out signals by design. A wick through a trendline does not trigger an alert — only a confirmed candle close beyond the line does. This single filter dramatically improves the quality of break signals across all timeframes and pairs.
04Configuration: Getting the Most from Trendlines with Breaks
The indicator gives you control over the parameters that define how trendlines are drawn and when breaks are confirmed. Here is what each setting does in practice.
| Parameter | What It Controls | Recommended Starting Point |
|---|---|---|
| Pivot Lookback | How many candles either side of a swing point the indicator uses to validate a high or low as a pivot. Higher values = fewer but stronger trendlines. | 5–10 for swing trading; 3–5 for intraday |
| Trendline Length | Minimum number of candles a trendline must span to be considered valid. Prevents very short-term noise lines from generating signals. | 15+ candles for H1 and above |
| Break Confirmation | Whether the break is confirmed on candle close or on intrabar penetration. Close-based is strongly recommended to avoid fake-out entries. | Always use candle close |
| Alert Mode | Popup only, push notification only, or both. Push notifications allow you to trade break signals away from the screen. | Both — popup + push |
| Line Style | Solid, dashed, or dotted. Visual preference, but dashed lines are easier to read when multiple trendlines are active simultaneously. | Dashed for active lines, solid for broken |
05A Five-Step Framework for Trading Trendline Breaks
Let the indicator establish the trendline
Do not draw your own lines on top of the indicator’s. Trust the automated pivot detection. If you see a line you disagree with, adjust the pivot lookback parameter rather than overriding it manually — otherwise you introduce the same subjectivity the tool is designed to remove.
Note the break alert — but do not enter immediately
When the break alert fires, mark the candle that closed beyond the trendline. This is your signal candle, not your entry candle. Entering on the break candle itself exposes you to the retracement that almost always follows the initial break move.
Wait for the retest of the broken trendline
After a genuine break, price almost always returns to test the broken line from the other side — as new resistance (for bearish breaks) or new support (for bullish breaks). This retest is your entry point. It gives you a tighter stop loss and a better risk-to-reward ratio than the initial break candle entry.
Confirm with structure and context
Check that the break aligns with the higher timeframe trend and with a key structural level. Today’s gold break at $4,550 was valid partly because it aligned with the H4 chart’s descending structure from the $4,890 high. A trendline break that cuts across the higher timeframe trend has much lower follow-through probability.
Manage stop loss relative to the broken trendline
Place your stop loss on the other side of the broken trendline — not beyond the signal candle’s high or low. If the trendline was the key level, price returning to the wrong side of it invalidates the trade thesis. Keeping your stop tight to the line rather than the candle dramatically improves your average risk-to-reward across all break trades.
06Common Mistakes When Trading Trendline Breaks
Entering on the break candle instead of the retest. The break candle often represents the maximum momentum of the move. Entering there gives you the worst possible entry price, the widest stop loss placement, and the lowest risk-to-reward of the entire trade setup. Patience for the retest is the single biggest improvement most trendline traders can make.
Trading trendline breaks in isolation from higher timeframe context. A break on the M15 that goes against the H4 trend is a counter-trend trade dressed up as a breakout. Always confirm that the break direction is aligned with the higher timeframe structure before committing to a position.
Ignoring the economic calendar. Today’s BoE, ECB, and FOMC decisions created artificial trendline breaks — moves driven entirely by news flow rather than structural supply and demand. During major event windows, trendline breaks have higher fake-out rates. The indicator fires the alert; it is your job to check whether a high-impact event just occurred.
Treating every trendline as equal. A trendline connecting two pivot points has far less significance than one connecting five or six. The more times a trendline has been tested and held, the more meaningful its eventual break. Configure the minimum pivot count to ensure the indicator only highlights high-significance lines.
07Why Today’s Session Makes This the Right Tool Right Now
With the ECB holding at 2% and Lagarde taking centre stage, and the BoE holding at 3.75% while Bailey acknowledges the stagflation risk from Hormuz energy disruptions, the market is in a regime where levels matter more than momentum. Central banks are on hold. The narrative is unclear. Inflation expectations are rising while growth risks are increasing simultaneously.
In this environment, the market respects trendlines more aggressively than in trending regimes — because institutional players use them as reference points to position ahead of anticipated policy shifts. When EUR/USD tests its descending trendline from 1.1820 and fails, that failure is meaningful. When gold’s ascending trendline from its March lows breaks at $4,550, that break is a structural signal — not noise.
Never Miss a Trendline Break Again
The Trendlines with Breaks Indicator for MT5 automatically draws, tracks, and alerts you on every valid trendline break — across all pairs and timeframes, with push notification support so the market comes to you.
↗Conclusion
Today’s session — gold breaking $4,550, EUR/USD losing its footing on EU tariff fears, USD/JPY pressing above 160 — was a masterclass in structural trendline breaks. Each of these moves was telegraphed by the trendline structure before the news hit. The traders who were positioned correctly were not the ones with the fastest news feed. They were the ones watching the lines.
The market will keep breaking levels. The BoE and ECB tone on June, the next FOMC, the Hormuz situation, the EU tariff negotiations — all of these will produce new trendline breaks across gold, forex, and indices in the sessions ahead. Have the tool that tells you when they happen.