

This is one of the most common frustrations among traders who have recently discovered Smart Money Concepts and CHOCH/BOS analysis. The signals look clean in hindsight. They are far messier in real time.
The problem is rarely the concept itself. CHOCH and BOS are grounded in one of the oldest and most tested frameworks in technical analysis — the study of successive highs and lows first formalized by Charles Dow in the early 1900s and later expanded by Richard Wyckoff. The problem is how most traders interpret and act on these signals without understanding what they actually confirm, and what they do not.
By the end of this article you will have a clear rule set for when to act on a CHOCH signal, when to wait, and why the distinction matters.
01The Foundation: What Market Structure Actually Measures
Before CHOCH and BOS can make sense, you need a clear picture of what market structure is — because the terms are used loosely in most online content, and that looseness is where the confusion begins.
Market structure is the sequential relationship between swing highs and swing lows. Every chart is essentially a record of these sequences. Charles Dow observed that markets move in waves — advances and declines, each composed of smaller advances and declines. The direction of those waves, and whether each new wave exceeds or fails to match the previous one, tells you who is in control.
Three structural states exist:
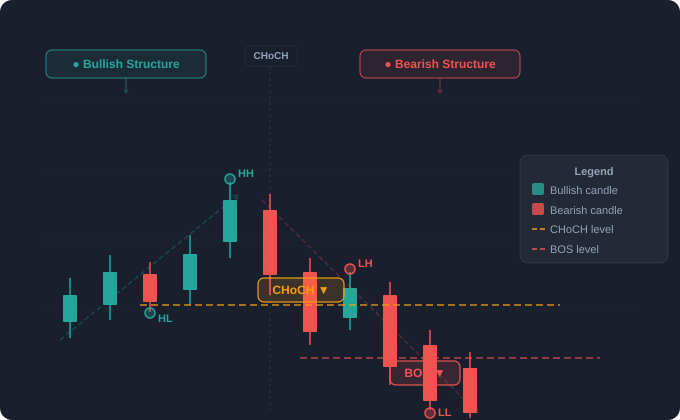
Bullish Structure
Price prints a sequence of higher highs (HH) and higher lows (HL). Each rally exceeds the previous peak. Each pullback holds above the previous trough. Buyers are dominant.
Bearish Structure
Price prints a sequence of lower lows (LL) and lower highs (LH). Each decline exceeds the previous trough. Each bounce fails to reach the previous peak. Sellers are dominant.
Ranging Structure
Price oscillates between a defined ceiling and floor without directional progress. Neither buyers nor sellers have control.
What the Smart Money Concepts community contributed — through educators like ICT (Michael Huddleston) — was a more granular labeling system: specifically, the distinction between a break of structure and a change of character.
02Break of Structure (BOS): The Trend Is Still Alive
A break of structure is the simpler of the two signals, and the one that carries less risk when acted upon. A BOS occurs when price breaks a swing point in the direction of the existing trend.
- →Price breaks above a previous higher high
- →The uptrend is continuing
- →Buyers pushed to a new peak
- →Trend continuation signal — not a reversal
- →Price breaks below a previous lower low
- →The downtrend is continuing
- →Sellers extended the decline
- →Trend continuation signal — not a reversal
What a BOS tells you: Nothing has changed. The existing trend remains valid. Its primary use is to confirm your higher timeframe bias is still intact, identify where trend-aligned pullback entries may develop, and avoid premature exits from profitable positions. A BOS is the market saying: “The dominant side just pressed their advantage.”
03Change of Character (CHOCH): Something Has Shifted — But What?
A change of character is a break of structure against the existing trend.
| Signal | Context | Level Broken | Interpretation |
|---|---|---|---|
| BOS (bullish) | Uptrend | Previous higher high | Trend continuing up |
| BOS (bearish) | Downtrend | Previous lower low | Trend continuing down |
| CHOCH (bull→bear) | Uptrend | Previous higher low | Potential reversal down |
| CHOCH (bear→bull) | Downtrend | Previous lower high | Potential reversal up |
Here is the sentence that most traders never read carefully enough:
04Why CHOCH Fails: The Liquidity Trap
Understanding why CHOCH signals fail is more valuable than understanding when they work — because it forces you to apply an additional filter before every entry.
Large participants — banks, hedge funds, and market makers — require substantial liquidity to fill their positions. That liquidity exists at predictable locations: just below swing lows where retail stop losses are clustered, and just above swing highs where breakout orders accumulate.
A common institutional pattern is to engineer a short-term move that breaks a structural level, triggering retail stops and breakout entries, then reverse sharply once that liquidity has been consumed. This engineered move produces a CHOCH signal on the chart — but it is not a genuine reversal. It is a liquidity sweep followed by a continuation of the original trend.
This is why a CHOCH without a subsequent confirming signal has a poor track record as a standalone entry trigger. The chart appears to signal a reversal. It is actually a trap. The key filter is what comes after the CHOCH.
05The CHOCH-to-BOS Sequence: The Only Entry Worth Taking
Never act on a CHOCH signal alone. Wait for a confirming BOS in the new direction.
After a genuine CHOCH, the following sequence should develop if the reversal is real:
CHOCH forms
Price breaks the structural level against the existing trend. This is the warning — not the entry.
Retracement follows
A bounce develops but fails to reach the previous extreme — forming a lower high (if reversing from bullish) or a higher low (if reversing from bearish).
BOS in the new direction confirms
The market breaks the CHOCH swing low (or high), producing a BOS in the new direction. Only now is a new structural sequence confirmed.
New trend structure begins
The first LH + LL (or HL + HH) of the new trend is now in place. This is the closest thing to objective reversal confirmation that pure price action offers.
This CHOCH-to-BOS sequence transforms a warning signal into a confirmation. It requires the market to form two structural data points in the new direction before you commit capital.
06A Step-by-Step Trading Framework for MT5
CHOCH and BOS signals labeled on a live MT5 chart — the sequence matters more than the individual signal
Establish higher timeframe bias
Begin on the Daily or H4 chart. Identify the current structural state: bullish (HH/HL), bearish (LL/LH), or ranging. This is your directional filter — you will only look for reversal setups that align with a potential shift in this structure.
Identify a CHOCH on a lower timeframe
Move to H1 or M15. Look for a CHOCH forming against the current minor trend, but in the direction your higher timeframe bias suggests a reversal may be developing. A CHOCH that conflicts with the higher timeframe structure is far less significant.
Wait for the confirming BOS
This is the most important step — and the one most traders skip. After the CHOCH, do not enter. Watch for the market to form a lower high (or higher low) and then produce a BOS that confirms the new structural direction.
Enter at a Point of Interest on the retest
After the confirming BOS, price frequently retraces to test the broken level — now functioning as resistance or support. This retest, often coinciding with an order block or fair value gap, is your entry zone. Entering here significantly improves your risk-to-reward ratio.
Manage the trade with structure
Your stop loss belongs beyond the structural invalidation point — above the CHOCH high if short, below the CHOCH low if long. Target the next significant structural level. Do not move your stop into profit until a new BOS in your direction confirms the new trend is developing.
07The One Mistake That Makes CHOCH Strategies Unprofitable
Of all the errors traders make with this framework, one is responsible for the majority of losing trades: trading CHOCH signals on a timeframe that conflicts with the dominant structure on a higher timeframe.
A CHOCH on M15 within a strong daily uptrend is not a reversal signal. It is a pullback. What looks like a reversal on M15 is simply a retracement to the next demand zone before the higher timeframe trend resumes.
The fix is simple but requires discipline: always check one timeframe above your signal timeframe before acting. If the higher timeframe is printing a healthy BOS sequence in one direction, a counter-trend CHOCH on the lower timeframe is noise. Trade with the higher timeframe structure, not against it, until the higher timeframe itself produces a CHOCH.
08Common Errors at a Glance
Acting on the CHOCH candle close. The candle that produces the CHOCH has not yet confirmed anything except one broken level. Wait for the full sequence to develop before committing capital.
Using a swing detection period that is too small. If your indicator’s sensitivity is set too low, every small pullback generates a CHOCH signal. Increase the fractal period until only meaningful structural levels are detected.
Ignoring the quality of the CHOCH. A break that barely clears the structural level by a few pips and immediately closes back above it is far less significant than one with a strong close and clear momentum. The strength of the break matters.
Forgetting liquidity context. If the CHOCH break occurs directly into a large pool of liquidity — a previous high or low where many stops are resting — the probability that the move is a sweep rather than a reversal is elevated. Be more cautious in these zones.
09What to Look for in a Market Structure Indicator
Manually identifying every swing high and low across multiple timeframes is time-consuming and prone to human error, particularly in fast-moving sessions. If you choose to use a dedicated market structure indicator, there are several qualities worth evaluating before relying on any tool.
Trade CHOCH and BOS on MT5 — Automatically
Our Market Structure CHoCH/BOS indicator for MT5 labels every structural signal in real time, with configurable sensitivity, no repainting, and full EA compatibility.
↗Conclusion
The reason CHOCH signals fail is not that the concept is flawed. It is that a single structural break is insufficient evidence of a trend change. Markets routinely breach structural levels to collect liquidity before continuing in the original direction.
Apply these four conditions consistently, and the CHOCH/BOS framework stops being a source of frustration and starts functioning as one of the clearest reversal identification tools available in price action trading.
📚References & Further Reading
- Nelson, S.A. (1903). The ABC of Stock Speculation. Wall Street Library. (Compilation of Charles Dow’s original writings on market theory.)
- Wyckoff, R.D. (1910). Studies in Tape Reading. The Ticker Publishing Company.
- Murphy, J.J. (1999). Technical Analysis of the Financial Markets. New York Institute of Finance. (Chapter 4: Trend — the foundation of modern structural analysis.)