
Trendlines with Breaks Indicator for MT5
Automatically plot pivot-based trendlines in MetaTrader 5 that adapt their slope, and get highlighted signals when price breaks through them.
- MetaTrader 5
- Works on VPS
- Lifetime support
About Trendlines with Breaks Indicator for MT5
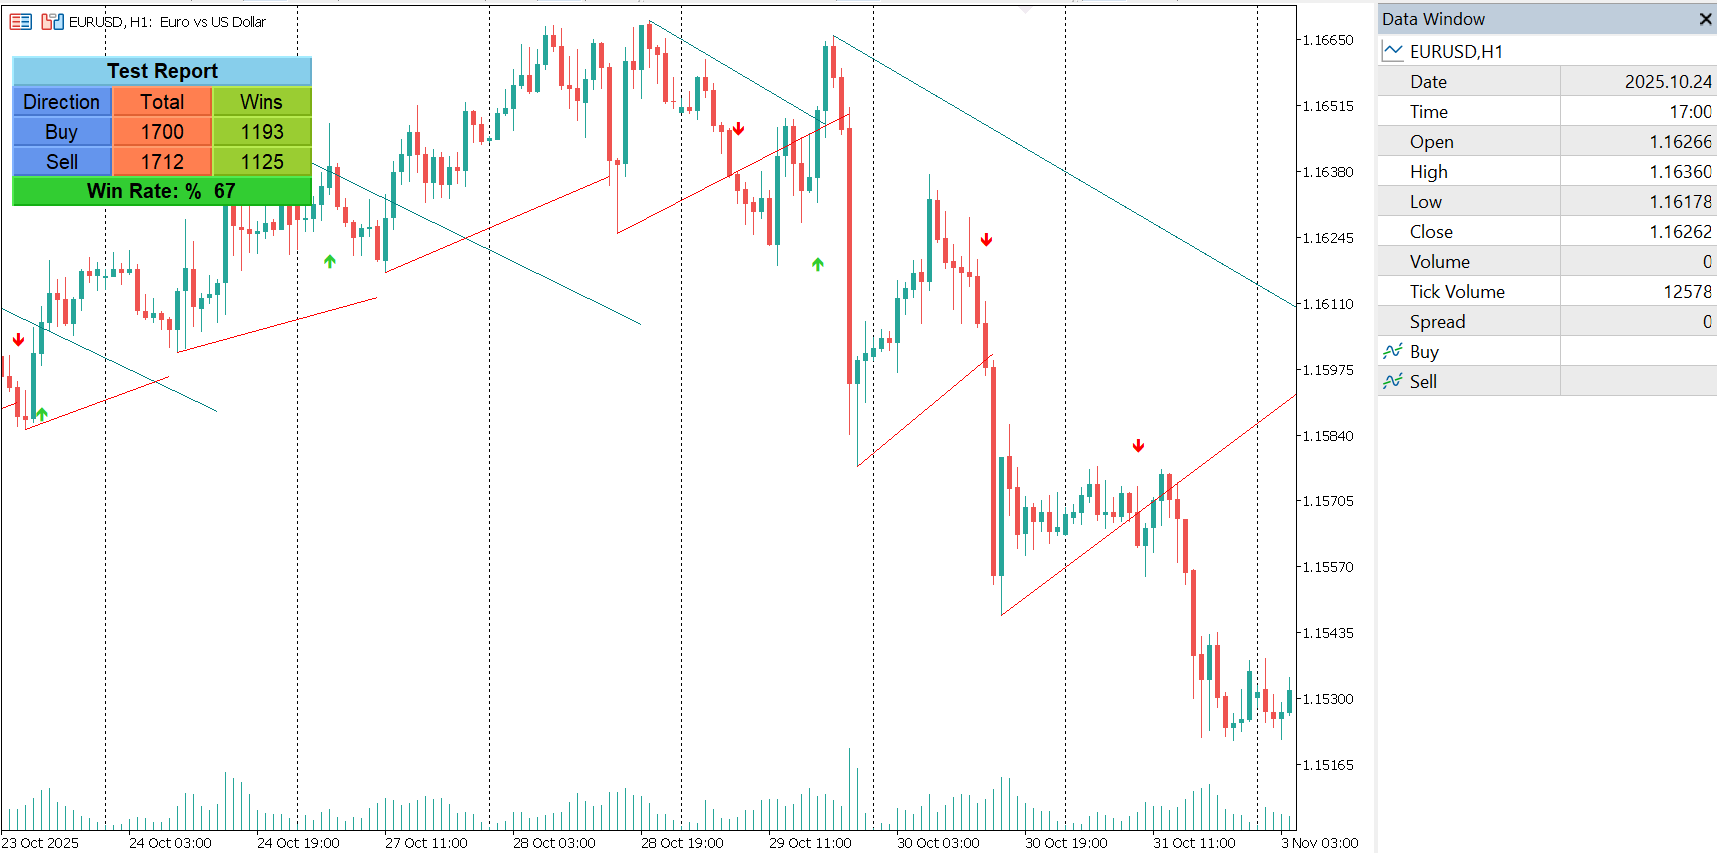
In short: the Trendlines with Breaks indicator for MetaTrader 5 draws trendlines from recent swing highs and lows automatically and marks the moment price breaks through one.
When to use it
- Breakout trading: get a signal as soon as price closes through a trendline.
- Price action analysis: save the time of drawing and updating trendlines by hand.
- Support and resistance: set Slope to 0 to get flat levels instead of angled lines.
How it differs
Hand-drawn trendlines are subjective and go stale. This indicator builds them from pivots using a slope you control, updates them as new swings form, and calculates breakout signals in real time without backpainting.
Getting started
- Set Length to the pivot period you want; larger values use bigger swings.
- Adjust Slope for steeper or flatter lines; 0 gives horizontal levels.
- Choose the slope calculation method, such as ATR.
- Disable trendline updates if you prefer fully static lines.
For a worked example, read how to trade trendline breaks on MT5.
Frequently asked questions
Does it repaint?
Breakout signals are calculated in real time and do not backpaint. The trendlines themselves can update as new pivots form, and you can turn that off for static lines.
What does the Slope setting do?
It controls how steep the trendlines are. Higher values give steeper lines; 0 turns them into flat support and resistance levels.
What is Length?
The pivot period used to find the swing highs and lows the trendlines are drawn from.
Is there a free demo?
Yes. You can download a free demo from the MQL5 Market and run it in the MetaTrader 5 Strategy Tester before buying.
Full product description
Trendlines with Breaks
Overview
The Trendlines with Breaks indicator automatically detects and plots pivot-based trendlines, dynamically adjusting their slope and steepness to highlight significant breakout events. Designed for traders who rely on price action and market structure, this tool provides an automated, real-time way to track evolving momentum and breakout confirmations.
How It Works
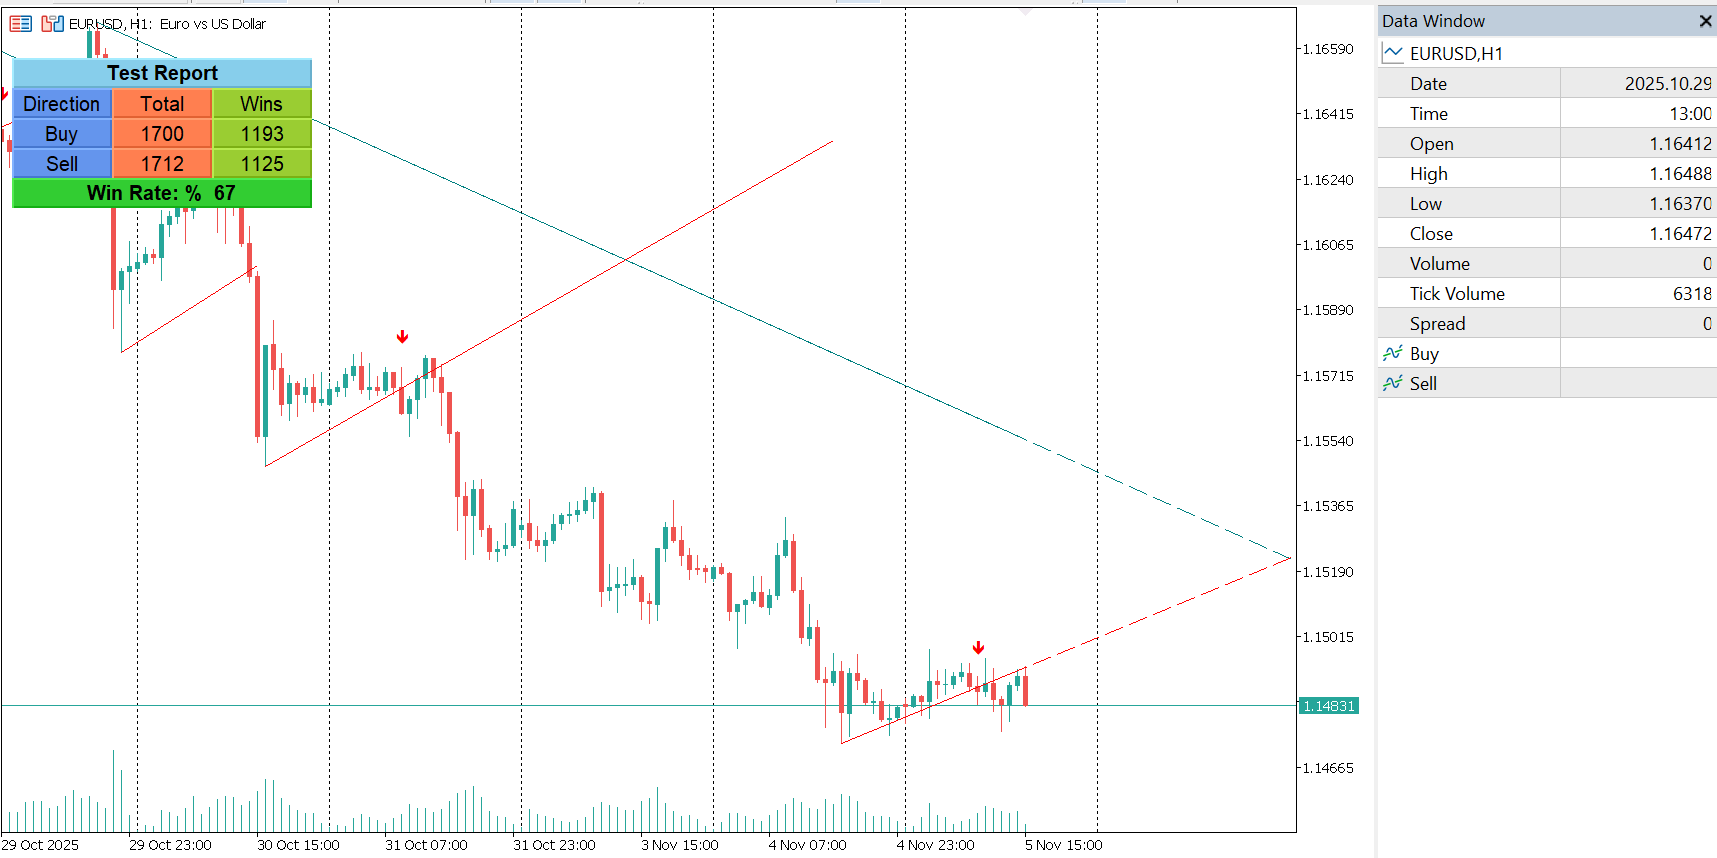
The indicator identifies swing highs and swing lows, connecting them to form adaptive trendlines based on user-defined pivot lengths and slope parameters.
A lookback candle range determines how far back the indicator analyzes price data before beginning to draw trendlines, ensuring optimal performance and visual clarity.
Each time price crosses one of these lines, a trendline breakout is instantly detected and highlighted on the chart.
Breakout signals are calculated in real time, ensuring no backpainting.
Trendlines themselves may repaint as new pivot points form, but this behavior can be disabled through user settings for fully static visualization.
Inputs
-
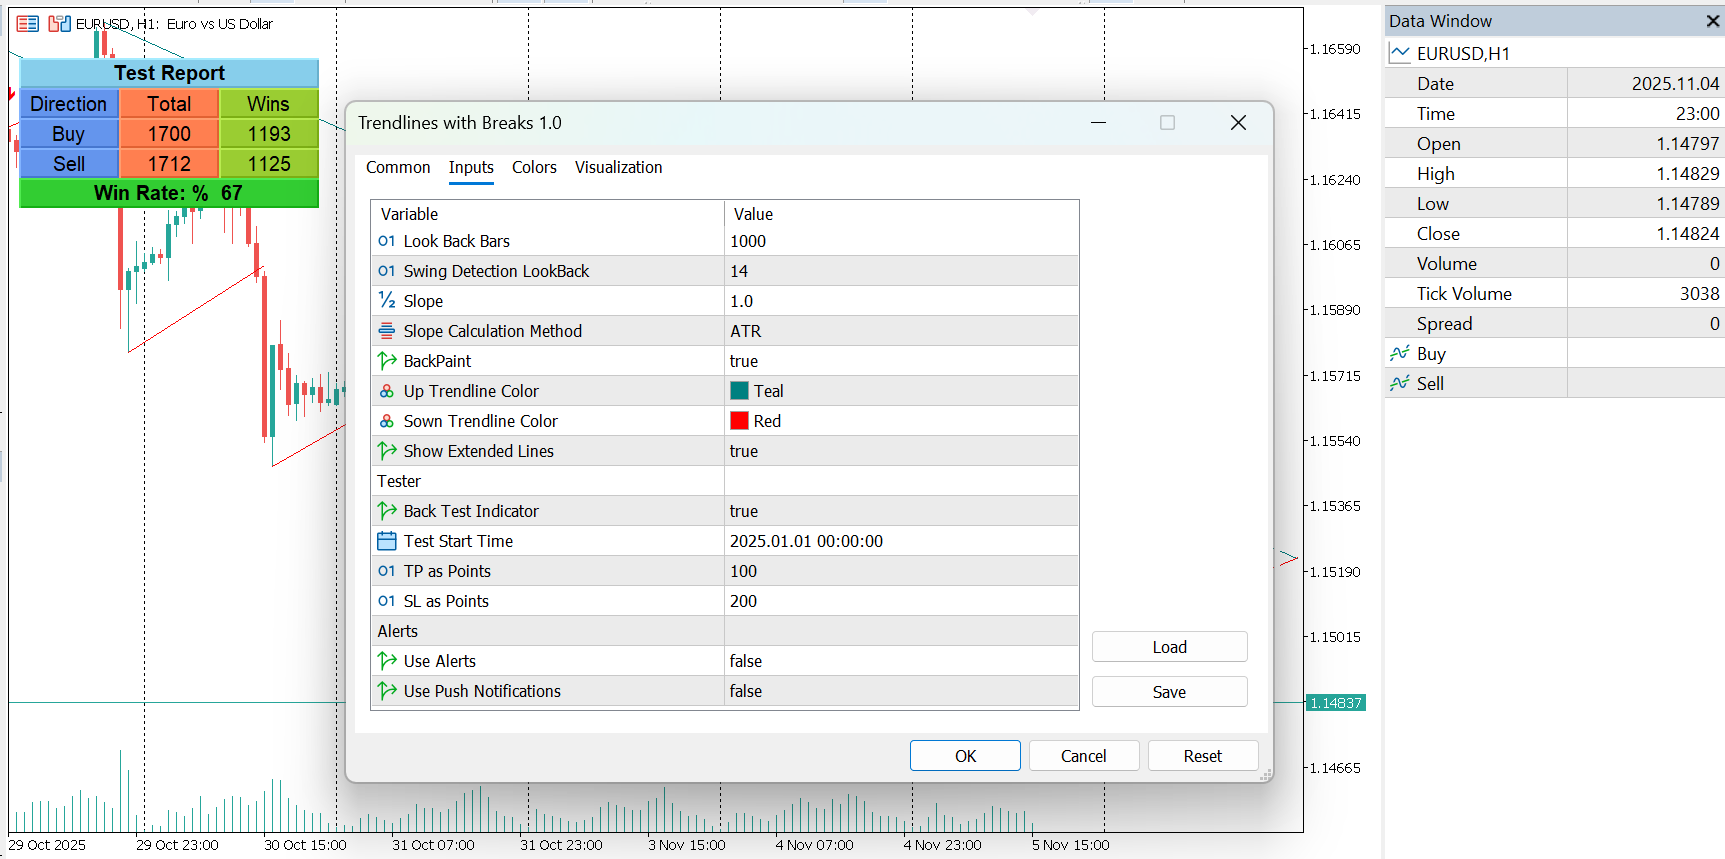
Length: Determines the pivot period for trendline generation.
-
Slope: Controls trendline steepness. Higher values yield steeper trendlines, while setting this to 0 converts trendlines into flat support/resistance levels.
-
Slope Calculation Method: Defines how slope is computed. Options include:
-
ATR: Uses Average True Range for consistent slope scaling.
-
Stdev: Uses Standard Deviation for volatility-based slope calculation.
-
Linreg: Uses Linear Regression slope for smoother, directionally stable lines.
-
-
Backpaint: Determines whether trendlines are offset backward (for historical visualization) or plotted in real time without delay.
-
Lookback: Defines how many past candles to consider when starting to draw trendlines.
Features
-
Fully automated pivot-based trendline generation.
-
Real-time breakout detection with no backpainting of signals.
-
Integrated alerts and push notifications for instant breakout updates.
-
Adjustable slope intensity and calculation method for flexible adaptation to all market conditions.
-
Optional trendline extension for continuous projection.
-
Built-in backtesting panel to measure trade performance, win rate, and signal accuracy directly on the chart.
-
Option to disable trendline repainting for static visualization and clearer analysis.
Usage
Use this indicator to:
-
Identify and track evolving support and resistance zones.
-
Confirm breakouts from established structures or channels.
-
Combine it with price action, momentum, or volume-based strategies for refined entry and exit timing.
The chosen slope method defines its behavior:
-
ATR: Offers smoother and more consistent angles under volatile conditions.
-
Stdev: Reflects real-time volatility fluctuations for adaptive trendlines.
-
Linreg: Provides the most stable, linear slope—ideal for structural and directional analysis.
Whether for swing trading, breakout confirmation, or trend structure mapping, Trendlines with Breaks offers a precise, adaptive, and fully automated approach to price structure analysis.
Ready to try Trendlines with Breaks Indicator for MT5?
Download it from the MQL5 Market and attach it to your MetaTrader 5 chart in minutes.
Want it customized or need something similar? Request a free quoteTrading involves risk. Our indicators are analysis tools for educational and informational purposes and do not constitute financial advice. Read our Disclaimer.
More indicators
HaP MACD Leader Signals and Analyzer
HaP MACD is a DEMA-assisted evolution of the classic MACD for MT5, giving faster momentum feedback and clearer trend signals. Features and video demo.
View details →
Twin Range Filter Indicator for MT5
The Twin Range Filter for MT5 combines two adaptive range filters to detect trend direction and potential entries with less market noise.
View details →
Fibonacci Bollinger Bands indicator for MT5
Fibonacci Bollinger Bands for MT5 combine Bollinger Bands with Fibonacci levels to map dynamic support and resistance zones around price.
View details →