

KagiChart for MetaTrader 5
Introduction
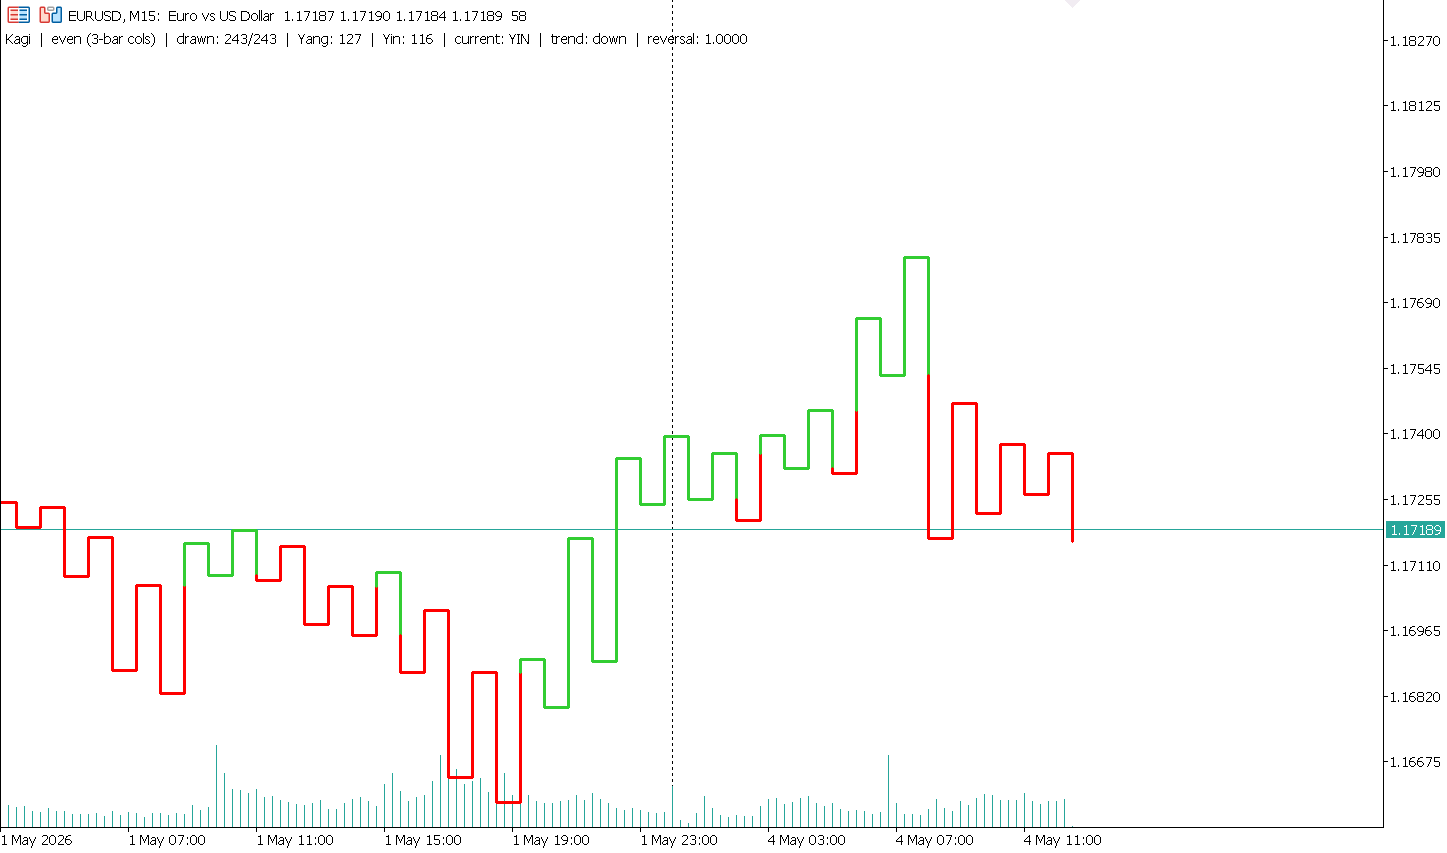
KagiChart is a time-independent charting indicator designed for MetaTrader 5.
It renders Kagi lines directly on the chart window, focusing on price movement and reversal structure rather than time-based candles.
What is a Kagi Chart
Kagi is a charting method that represents price movement without using fixed time intervals.
Instead of plotting candles at regular time steps, the chart changes direction only when price reverses by a defined amount.
The chart consists of continuous lines that reflect market structure:
- Yang lines represent upward movement after price exceeds a previous high
- Yin lines represent downward movement after price falls below a previous low
This approach helps visualize trend structure and price movement without time-based noise.
Indicator Logic
The indicator builds Kagi lines using reversal thresholds.
A new segment is created only when price moves beyond the defined reversal level.
- Upward movement continues until a downward reversal condition is met
- Downward movement continues until an upward reversal condition is met
- Trend state changes when previous structural levels are broken
Rendering Features
- Vertical segments connected by horizontal lines
- Even column spacing based on bar index
- Consistent spacing regardless of time gaps
- Accurate handling of session gaps and weekends
- Yang and Yin transitions occur at the exact price level where structure is broken
- Mid-segment transitions are supported
Features
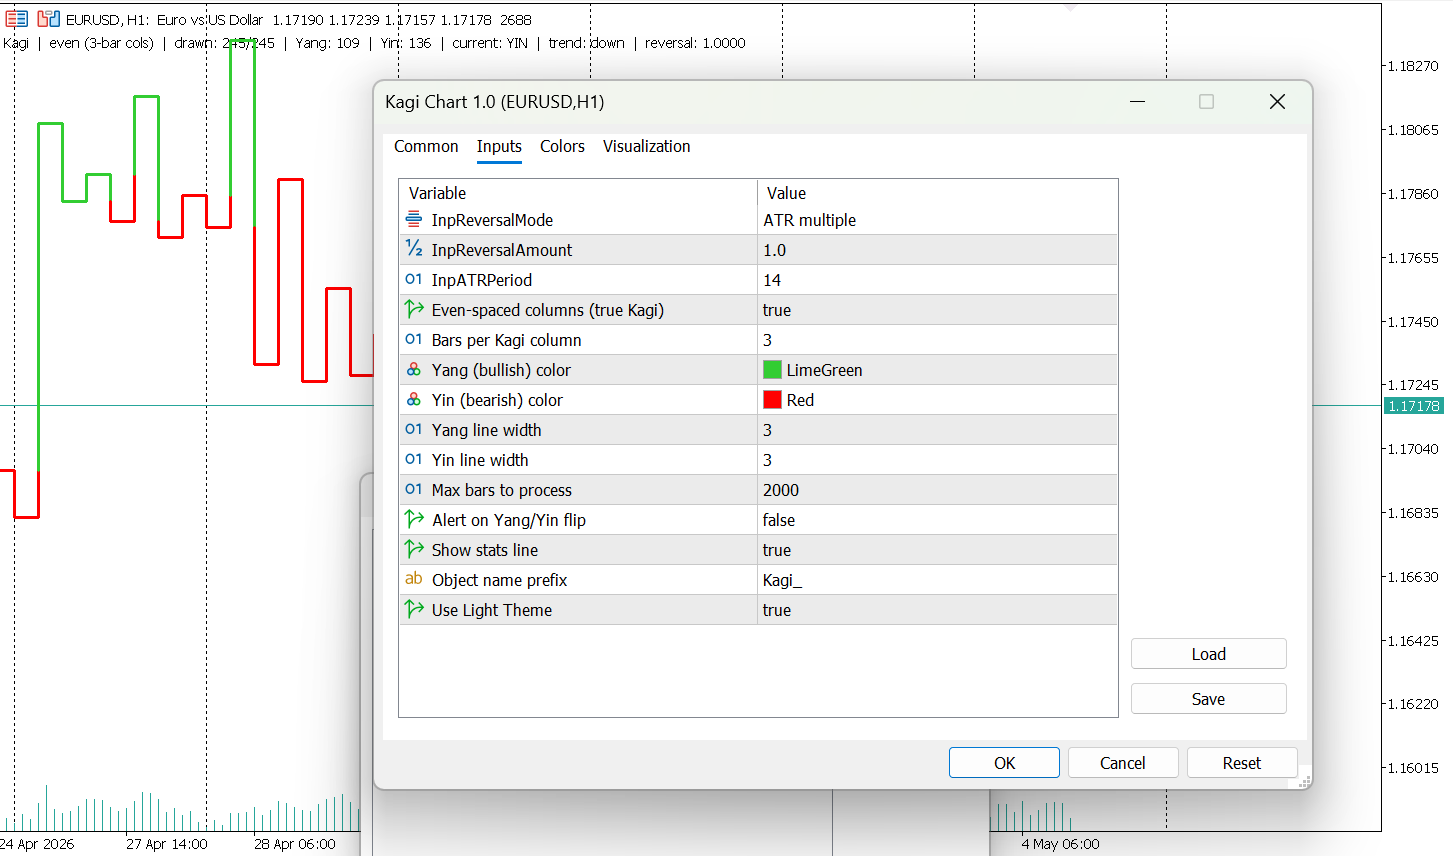
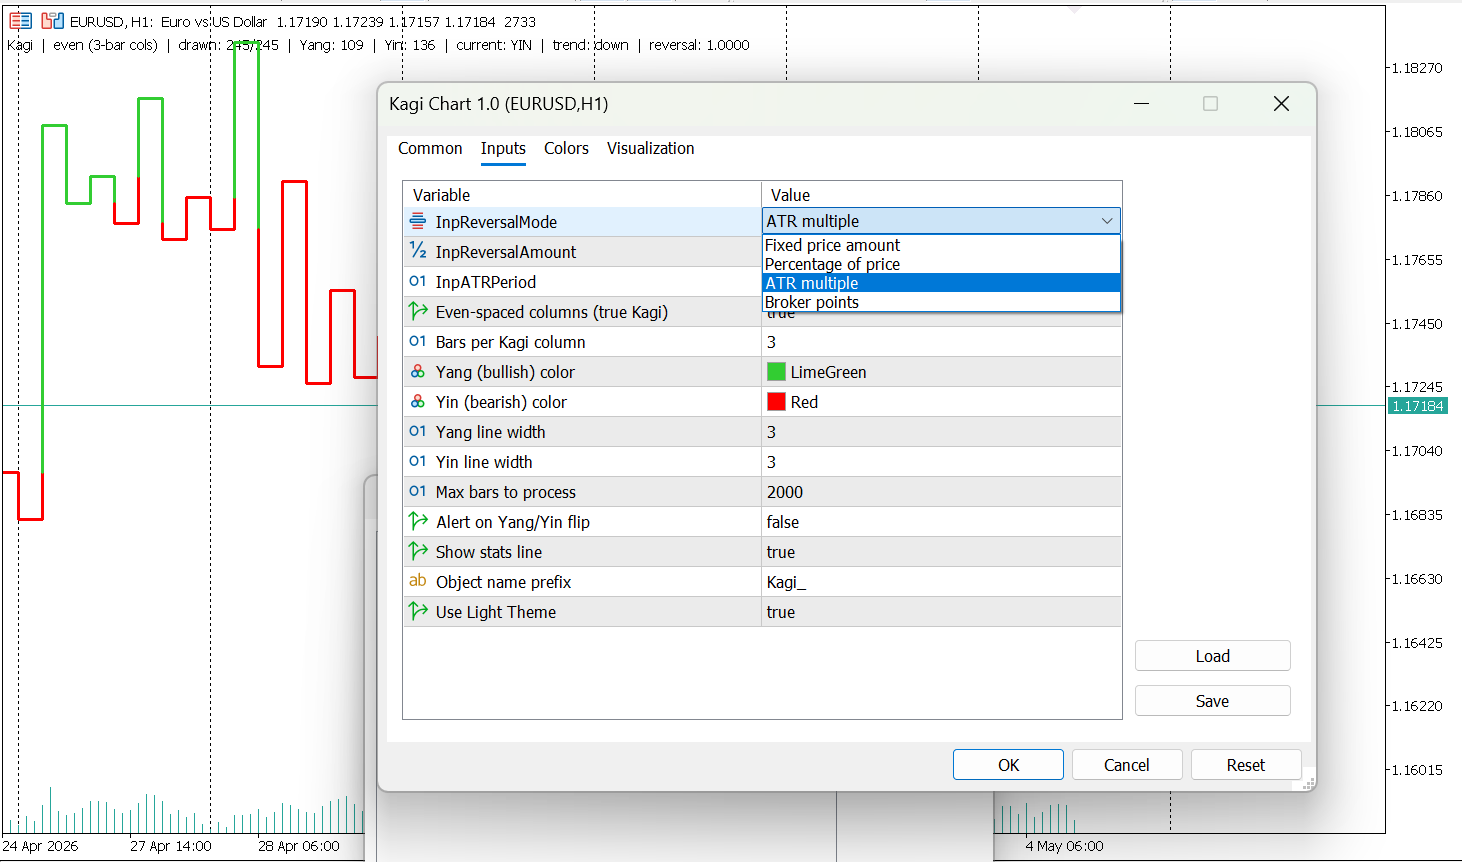
Reversal Modes
- Percentage based reversal
- ATR-based reversal
- Fixed price reversal
- Broker point-based reversal
Visual Settings
- Custom colors for Yang and Yin states
- Adjustable line thickness
- Configurable column width
- Optional even-spacing mode
Information Display
- Current Yang or Yin state
- Swing count
- Current trend direction
Alerts
- Optional notification when trend state changes
Performance Control
- Adjustable maximum number of processed bars
Usage
The indicator can be used to observe price structure and trend changes based on reversal logic.
It may also be combined with other analytical tools.
Limitations
- This is a visualization indicator and does not execute trades
- It does not provide trading signals as indicator buffers
- It does not expose data buffers for Expert Advisor integration
- The chart is recalculated on each update
- It does not predict future market behavior
Installation
- Open MetaEditor in MetaTrader 5
- Place the file in the MQL5/Indicators folder
- Compile the file
- Attach the indicator to a chart from the Navigator panel
- Adjust input parameters as needed
Recommended Settings
- Forex: ATR mode, period 14
- Indices and metals: Percentage mode
- Crypto: Percentage mode with higher values
Settings can be adjusted depending on instrument volatility and preferred sensitivity.
Notes
Kagi charts are designed to reduce the impact of small price fluctuations.
They may show fewer movements during low-volatility conditions and more structure during directional moves.
Disclaimer
This indicator is provided for analytical purposes only.
It does not provide investment advice and does not guarantee results.
")
")
")
")
")
")
")
")
")
")
")
")
")
")
")
")

")
")
")
")
")
")
")
")

")
")
")
")
")
")
")
")
")

")
")
")
")
")
")
")
")