
Slope MA Indicator for MT5
Slope MA for MetaTrader 5 measures the slope of a moving average relative to ATR and colors it by directional bias, with a built-in tester.
- MetaTrader 5
- Works on VPS
- Lifetime support
See it on the chart
About Slope MA Indicator for MT5
In short: Slope MA for MetaTrader 5 measures the slope of an EMA, normalizes it by ATR so it is comparable across markets, colors the slope line when it crosses your upper or lower thresholds, and plots buy and sell arrows when slope conditions change.
Why look at the slope of a moving average?
Most traders watch whether price is above or below a moving average. The slope of the average says something different: how strongly the trend is moving. A flat average means no direction; a steeply rising one means an established, accelerating move. Slope often changes before the price crosses the average, so it can show the start or end of directional momentum earlier.
Why ATR normalization matters
A raw slope is hard to compare. A 5-point rise per bar is huge on one instrument and trivial on another. Slope MA divides the EMA’s slope by ATR, so the reading expresses the move in units of the market’s own volatility. That lets you use the same thresholds across symbols and timeframes, which is rarely possible with an unscaled slope.
How to read the indicator
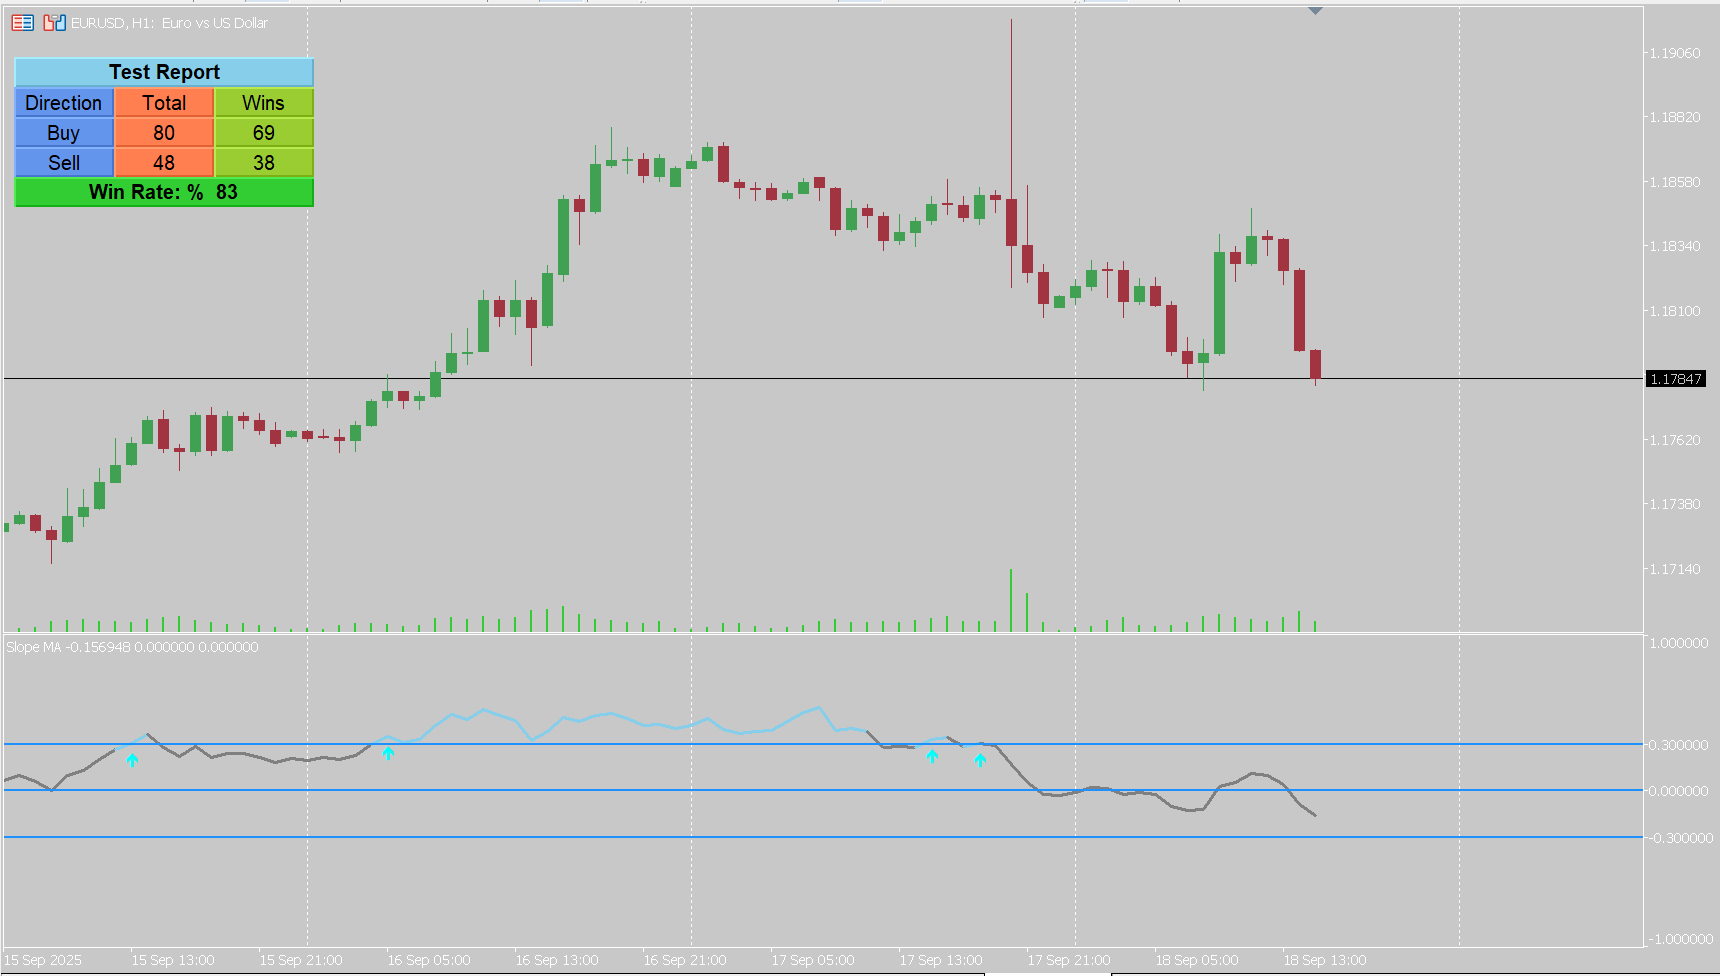
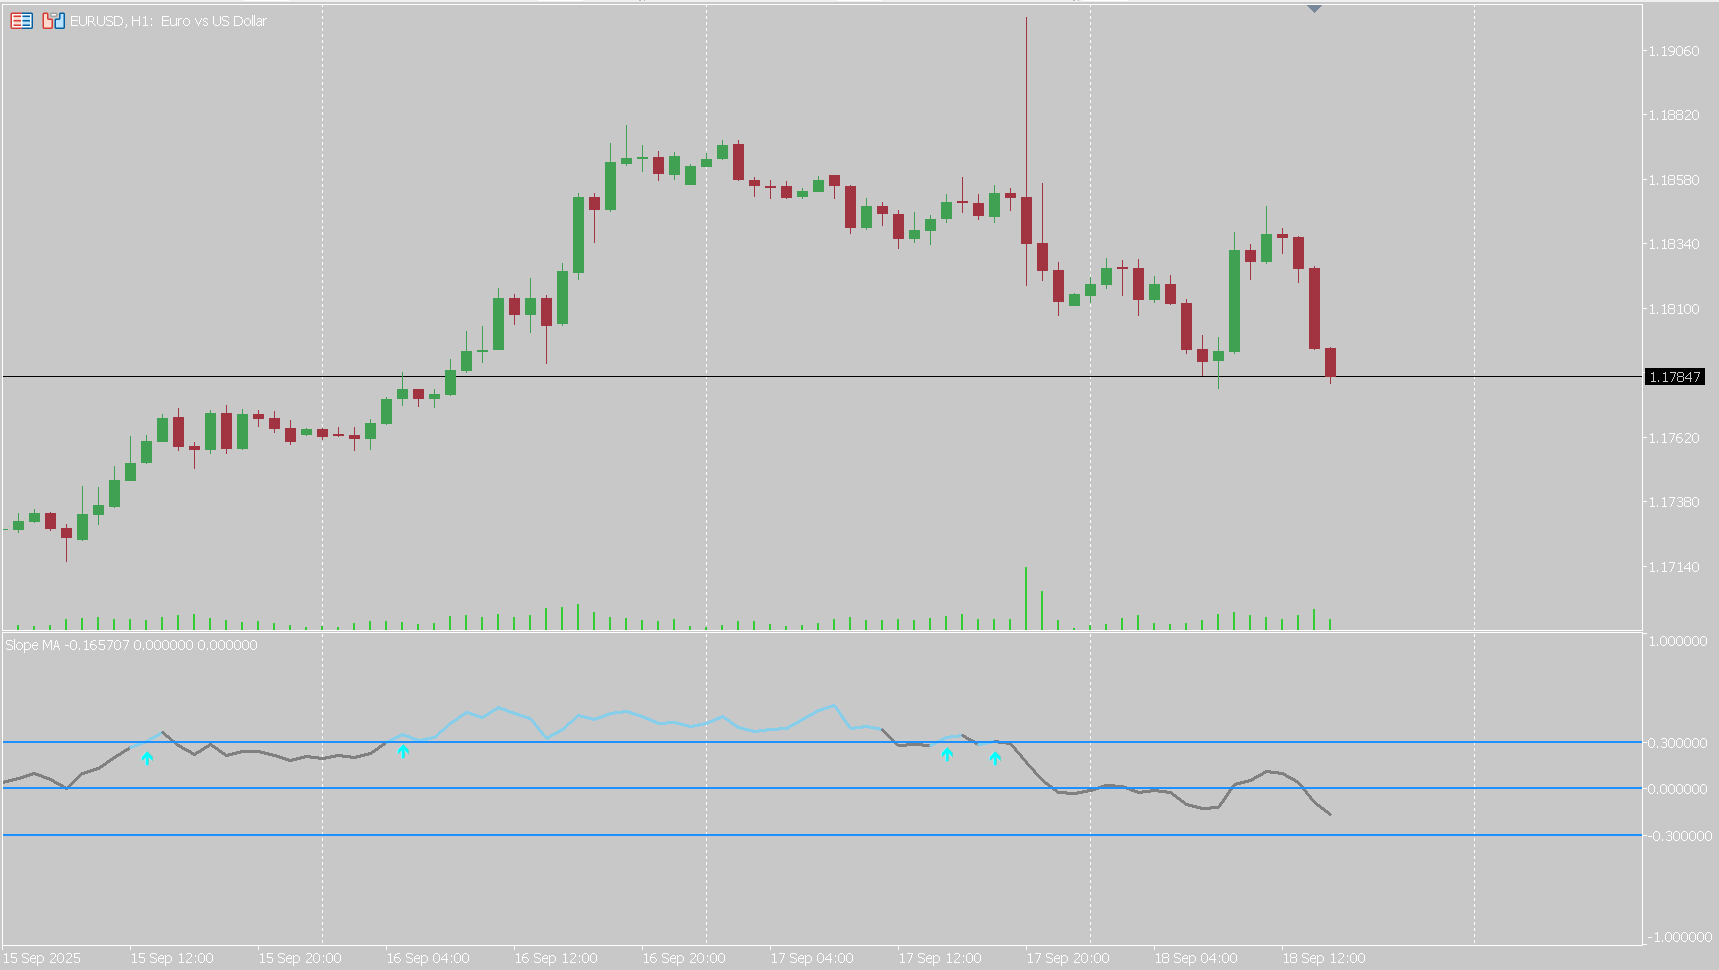
- Slope line above the upper threshold: strong upward slope; the line changes color to show bullish bias.
- Slope line below the lower threshold: strong downward slope; the line changes color to show bearish bias.
- Between the thresholds: weak or no directional bias, often a ranging market.
- Arrows: plotted when the slope shifts from one state to another, marking potential starts or ends of a directional move.
Settings
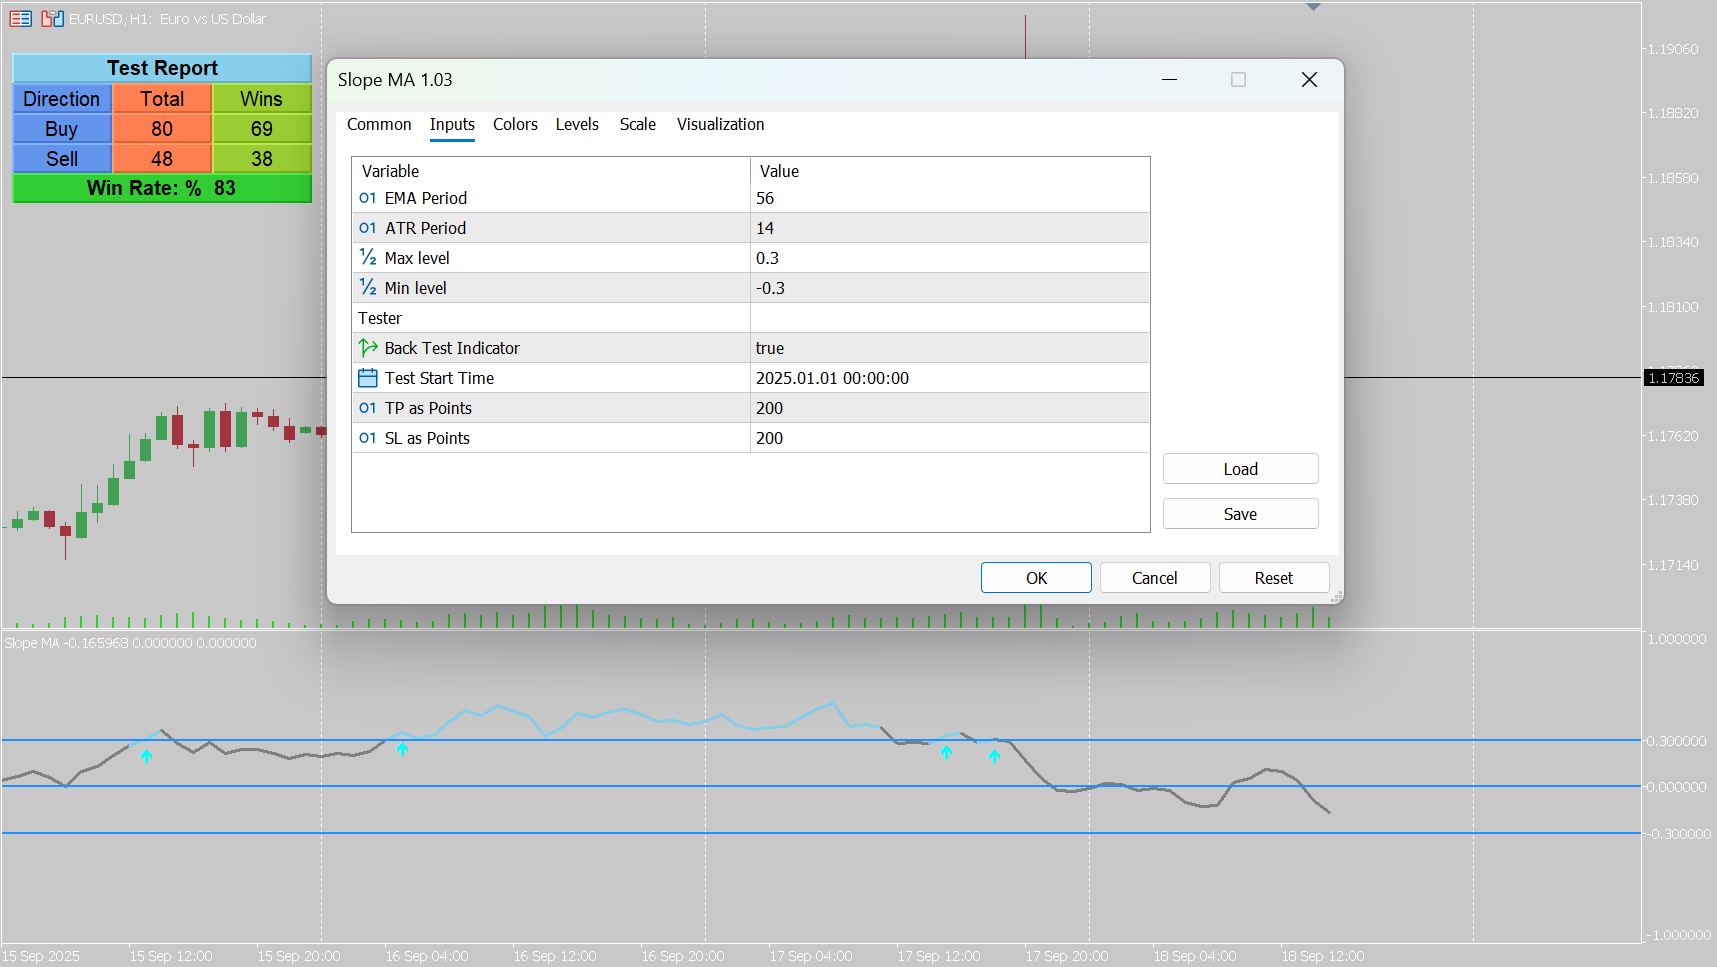
- EMA period – which moving average’s slope is measured. Shorter reacts faster; longer is steadier.
- ATR period – how volatility is measured for the normalization.
- Upper and lower thresholds – how strong a slope must be to count as a bullish or bearish state. Wider thresholds give fewer, stronger signals.
Ways to use it
- As a trend filter: only take long trades when the slope is in bullish territory, and short trades when it is bearish.
- To avoid chop: stay out when the line sits between the thresholds.
- To spot exhaustion: a slope that stops rising while price keeps making highs can warn of a weakening move.
It pairs well with other trend tools. See the TRAMA indicator for an adaptive moving average, or the CM Ultimate indicator for a multi-tool view.
Review before you trade
Enable the tester panel to see how many signals the settings would have produced and their win rate since a date you choose, using your own TP and SL. Compare a few threshold levels across the symbols you trade.
Frequently asked questions
What does the Slope MA measure?
The slope of an EMA, normalized by ATR. In other words, how quickly the moving average is rising or falling, scaled to the market’s current volatility.
Why normalize the slope by ATR?
A raw slope depends on the symbol’s price and volatility, so a value that is steep on one market is flat on another. Dividing by ATR puts readings on a comparable scale across symbols and timeframes.
What do the line colors mean?
The slope line changes color when its value goes above your upper threshold or below your lower threshold, showing the directional bias.
When do buy and sell arrows appear?
When slope conditions shift across the thresholds. Arrows mark the transitions between slope states.
What can I configure?
The EMA period, the ATR period and the upper and lower threshold levels.
How does the tester panel work?
If enabled, an on-chart panel shows the number of signals, trade outcomes and win rate from the start date you choose, using the take-profit and stop-loss you set in points.
Is there a free demo?
Yes. Download the free demo from the MQL5 Market and run it in the MetaTrader 5 Strategy Tester before buying.
Slope MA is an analysis tool and does not guarantee trading results.
Ready to try Slope MA Indicator for MT5?
Download it from the MQL5 Market and attach it to your MetaTrader 5 chart in minutes.
Want it customized or need something similar? Request a free quoteTrading involves risk. Our indicators are analysis tools for educational and informational purposes and do not constitute financial advice. Read our Disclaimer.
More indicators

Madrid Ribbon Indicator for MT5
Madrid Ribbon for MetaTrader 5 combines multiple moving averages into a color-coded ribbon that shows trend direction, strength and changes.
View details →
Optimized Trend Tracker Oscillator Indicator for MT5 (OTTO)
OTTO, the Optimized Trend Tracker Oscillator for MT5, gives adaptive, multi-layered trend signals for traders who want clarity. Settings and video demo.
View details →
HalfTrend Indicator for MT5
HalfTrend for MetaTrader 5 uses highs, lows, a moving average and ATR to show trend direction and entry points. Settings explained, with video demo.
View details →