Timeframe: All Timeframes (Multi-Timeframe Support)
Trading Styles: Scalping, Day Trading, Swing Trading, Position Trading
Trading Markets: Forex, Stocks, Commodities, Indices, and Crypto
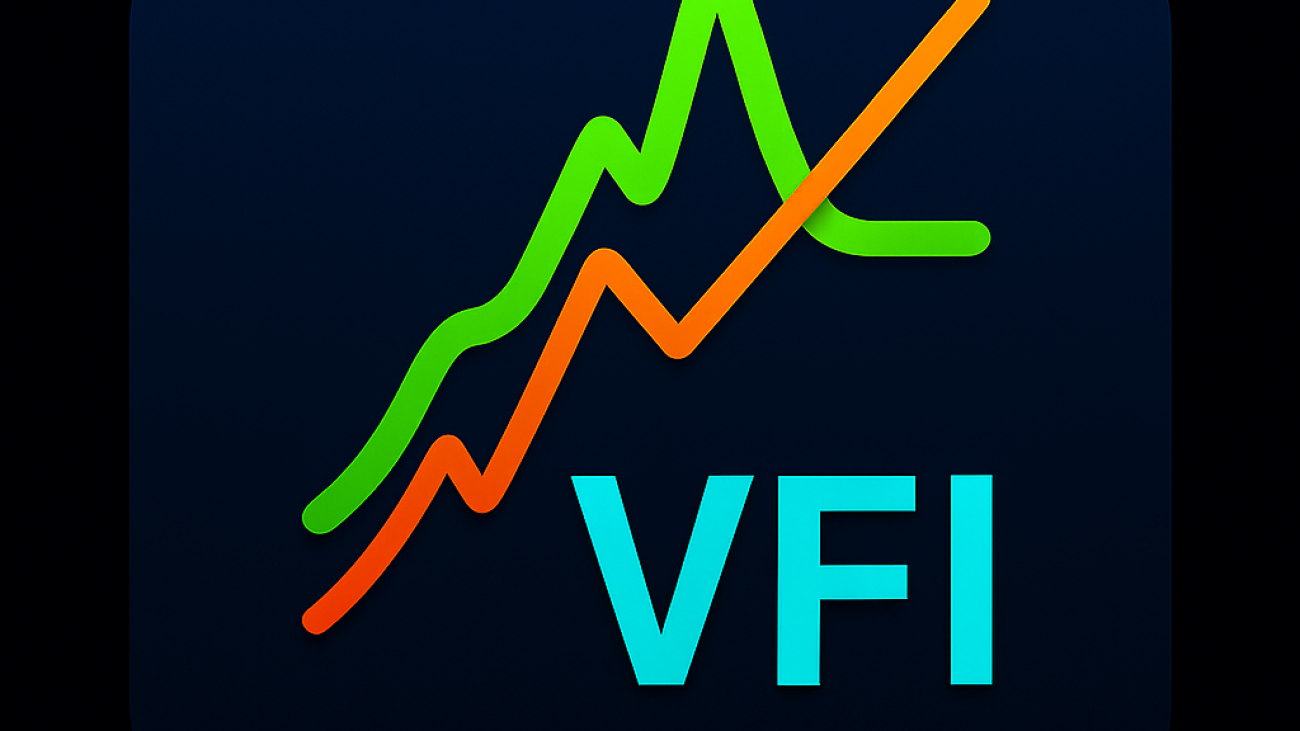
What does this indicator do?
The Volume Flow Indicator for MT5 has two bands and one histogram. One of the bands is EMA, and the other is the standard deviation of volume whenever they cross downside, it will generate a sell signal, and whenever they cross upward, it will generate a buy signal.
This makes it easy for traders to spot trend reversals and follow market momentum in any instrument.
Settings of the Indicator
Length of Volume for calculation
Coefficient parameter
Max volume cutoff
Signal length
Smoothing parameter
Show histogram of stdv.
Additional Parameters:
Tester Settings – for strategy testing and optimization.
Alert Settings – receive notifications and alerts on signal generation.
What are the benefits of this indicator?
Provides a potential reversal or trend continuation point in trending and ranging markets. Works on all timeframes and markets (Forex, Crypto, Stocks, Commodities). Helps traders follow trend reversals with confidence. Easy to use – suitable for both intermediate and professional traders. Can be combined with other technical analysis tools for even stronger trading strategies.
Timeframe: All Timeframes (Multi-Timeframe Support)
Trading Styles: Scalping, Day Trading, Swing Trading, Position Trading
Trading Markets: Forex, Stocks, Commodities, Indices, and Crypto
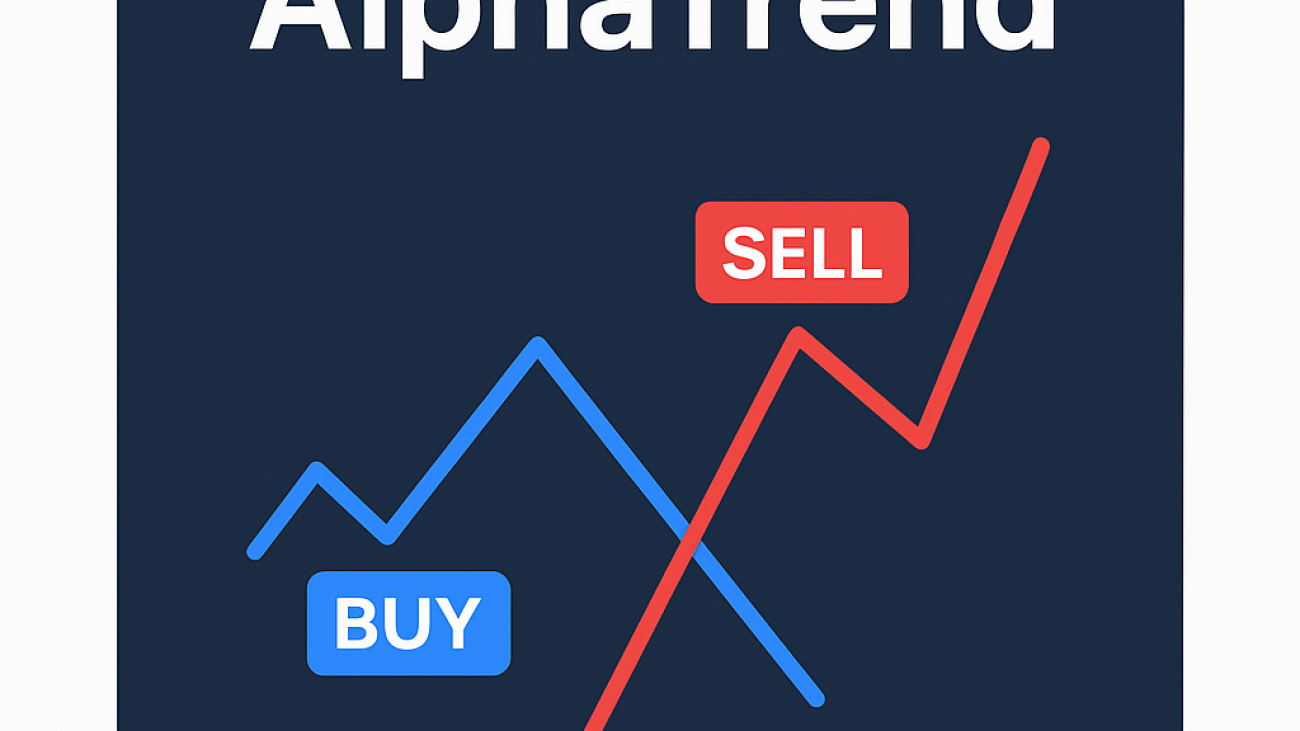
What does this indicator do?
The Alpha Trend Indicator for MT5 is designed to identify market trends and generate highly reliable buy and sell signals.
It plots two bands on the chart.
Whenever these two bands cross upward, the indicator generates a Buy Signal.
Whenever they cross downward, the indicator generates a Sell Signal.
This makes it easy for traders to spot trend reversals and follow market momentum in any instrument.
Settings of the Indicator
Multiplier – default value is 1.
Common Period – adjust sensitivity to market conditions.
Source of Price – Close, Open, High, Low, or other price modes.
Show Signals – enable/disable signal arrows.
Calculation Mode – option to calculate with or without volume data.
Additional Parameters:
Tester Settings – for strategy testing and optimization.
Alert Settings – receive notifications and alerts on signal generation.
What are the benefits of this indicator?
Provides accurate entry points in trending and ranging markets. Works on all timeframes and markets (Forex, Crypto, Stocks, Commodities). Helps traders follow trend reversals with confidence. Easy to use – suitable for both intermediate and professional traders. Can be combined with other technical analysis tools for even stronger trading strategies.
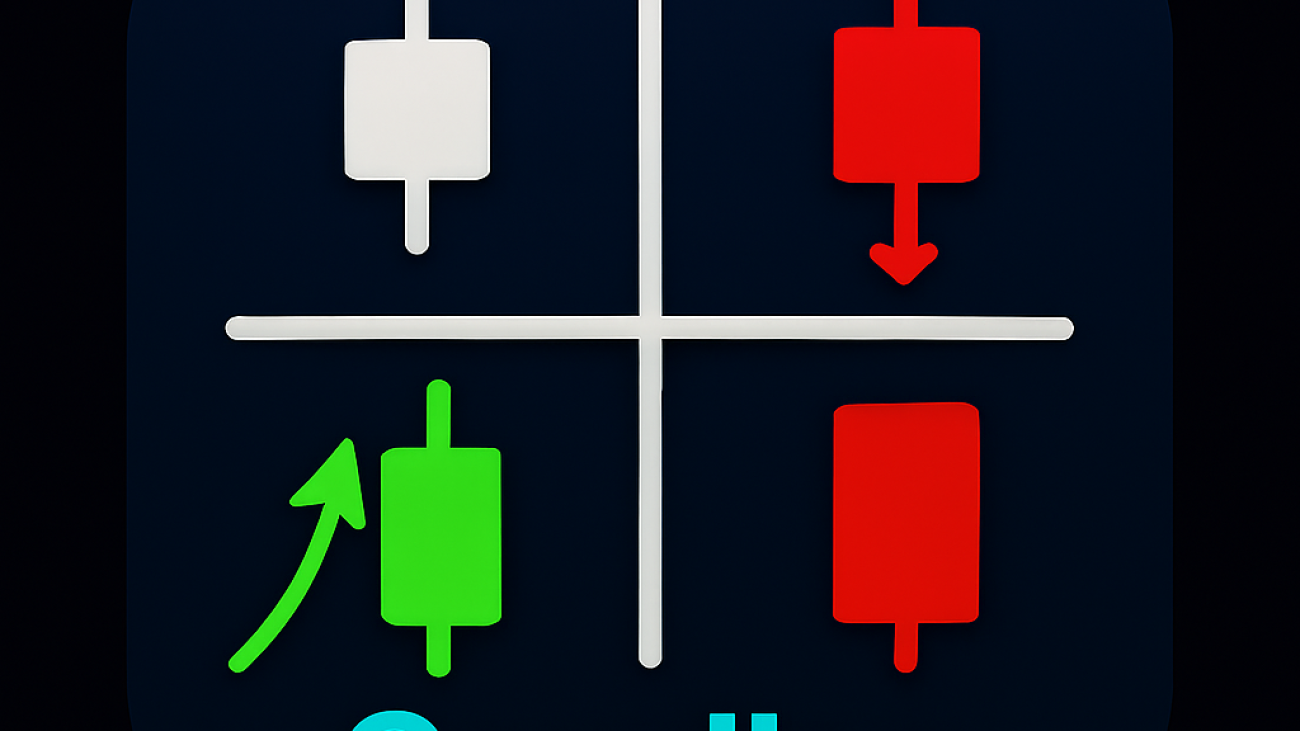
CandleStick Patterns Indicator for MT5 — Professional Pattern Scanner
Bring proven candlestick analysis into your workflow. This indicator automatically scans your chart and highlights high-quality reversal and continuation patterns, so you can react faster and with more confidence.
Check the “More from author” section on the Market page to see our full suite of indicators.
What it does
Scans historical and live candles from a user-defined lookback range.
Detects and labels major single- and multi-candle patterns with on-chart arrows and tooltips.
Sends alerts (terminal, push, email) the moment a valid pattern appears.
Includes a lightweight tester panel for quick parameter optimization.
Detectable Patterns
Doji (size filter)
Hammer, Inverted Hammer, Hanging Man, Shooting Star
Bullish/Bearish Engulfing
Bullish/Bearish Harami
Morning Star, Evening Star
Piercing Line, Dark Cloud Cover
Bullish Belt, Bullish Kicker, Bearish Kicker
Inputs & Settings
General
Candles to Consider (Lookback) – number of bars to scan.
Doji Size – max body-to-range ratio to qualify as doji.
Pattern Toggles 3. Show Doji 4. Show Evening Star 5. Show Morning Star 6. Show Hammer 7. Show Shooting Star 8. Show Inverted Hammer 9. Show Bearish Harami 10. Show Bullish Harami 11. Show Bearish Engulfing 12. Show Bullish Engulfing 13. Show Piercing Line 14. Show Bullish Belt 15. Show Bullish Kicker 16. Show Bearish Kicker 17. Show Hanging Man 18. Show Dark Cloud Cover
The indicator iterates through the last N candles (your lookback) and applies robust, textbook criteria for each enabled pattern. When a match is found, it draws an arrow at the signal bar and optionally prints a short label (pattern name). Alerts can be triggered immediately or on bar close, depending on MT5 settings.
Benefits
Clarity at a glance – auto-labels patterns you would otherwise scan manually.
Fewer missed setups – push/email alerts for your favorite patterns.
Customizable strictness – fine-tune doji size and enable only the patterns you trust.
Strategy-agnostic – use it for confirmations with trend, S/R, SMC, or volume tools.
Timeframe & symbol agnostic – works on FX, indices, commodities, crypto, and stocks in MT5.
Best Practices
Combine with trend filters (MA slope, structure, higher-TF bias) to improve selectivity.
Use S/R or supply–demand zones to prioritize higher-probability signals.
Prefer signals that align with session volatility and market context.
In Strategy Tester, adjust lookback and alert rules to match your trading style.
Compatibility
Platform: MetaTrader 5 (MT5)
Markets: Forex, indices, commodities, crypto, stocks (any symbol your broker provides)
Trading styles: position trading – swing trading – day trading – scalping
Timeframes: All
Notes
This tool is for educational and analytical purposes. It does not guarantee profits. Always validate signals with your own risk management.
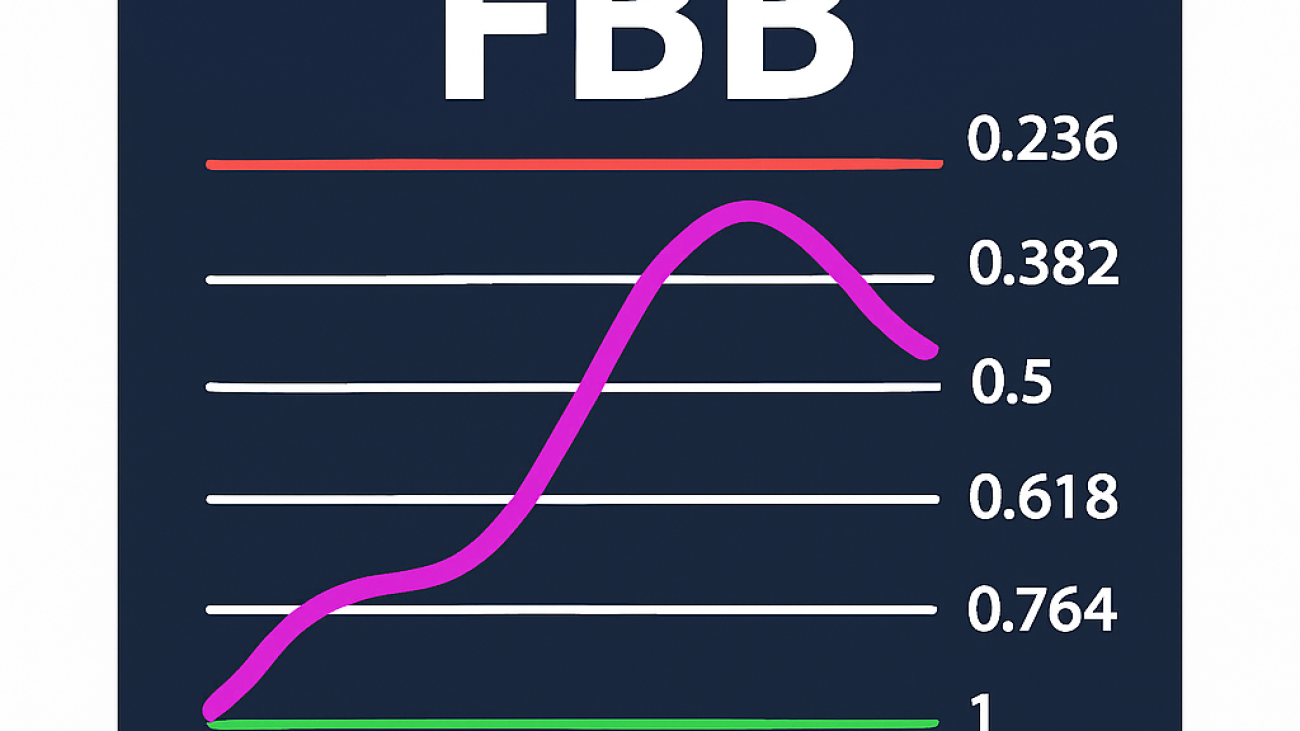
The Fibonacci Bollinger Bands Indicator for MetaTrader 5 (MT5) is a powerful trading tool that combines the strength of Bollinger Bands with Fibonacci retracement levels. Since price often reacts strongly to Fibonacci levels, this indicator helps traders identify high-probability reversal zones and breakout opportunities.
Key Features & Inputs
Bollinger Bands Length – customizable parameter for band calculation.
Price Mode Selection – choose from Close, Open, High, or Low prices.
Band Multiplier – adjust the distance between bands for market conditions.
Six Fibonacci Levels – fine-tuned parameters to set custom Fibonacci zones.
Backtesting & Alerts – integrated parameters for tester optimization, notifications, and push alerts to your mobile device.
How It Works
The indicator calculates six Fibonacci-based Bollinger Bands. When the price breaks above the highest band or below the lowest band, it generates buy or sell signals, giving traders reliable entry points for both trend continuation and reversal setups.
Benefits of the Indicator
Accurate Reversal Zones – combines Fibonacci and volatility analysis for precise signals.
Versatile for All Timeframes – works effectively on scalping, day trading, and swing trading.
Improved Risk Management – identifies key support and resistance levels to optimize stop loss and take profit placement.
Customizable Settings – full flexibility to adapt the indicator to your strategy.
Trading Confidence – alerts and notifications keep you updated without needing to constantly monitor charts.
The CM Ultimate MA Indicator for MetaTrader 5 is a powerful moving average–based trading tool designed for Forex, indices, stocks, and commodities. Unlike standard moving averages, this indicator adds advanced features for detecting trend direction, MA crossovers, and momentum shifts, giving traders reliable entry and exit signals.
Key Features
Dynamic Color Change – MA line changes color automatically based on trend direction.
Smoothing Options – Reduce noise and filter false signals.
Customizable MA Length – Adjust period for short-term or long-term trading.
Tilson T3 Factor – Add precision when using Tilson T3 moving average type.
Dual MA System – Second MA with color change based on its own direction.
Crossover Signals – Dots on chart highlight MA crossovers for trade entries.
Built-in Alerts & Notifications – Receive signals via pop-up, email, or push notification.
Tester Dashboard – Backtest results quickly and optimize your trading strategy.
How It Works
The indicator plots two moving averages that react dynamically to price action. When the color of the MA changes, it indicates a potential trend reversal or continuation, sending you instant alerts. When the two MAs cross, a signal dot appears, making it easier to spot high-probability setups.
Why Use It?
Works on all timeframes (scalping, day trading, swing trading).
Can be applied to Forex, indices, crypto, stocks, and commodities.
Simple to use as a standalone tool or as a confirmation filter within your own trading strategy.
Helps improve accuracy, reduce false entries, and increase profitability.
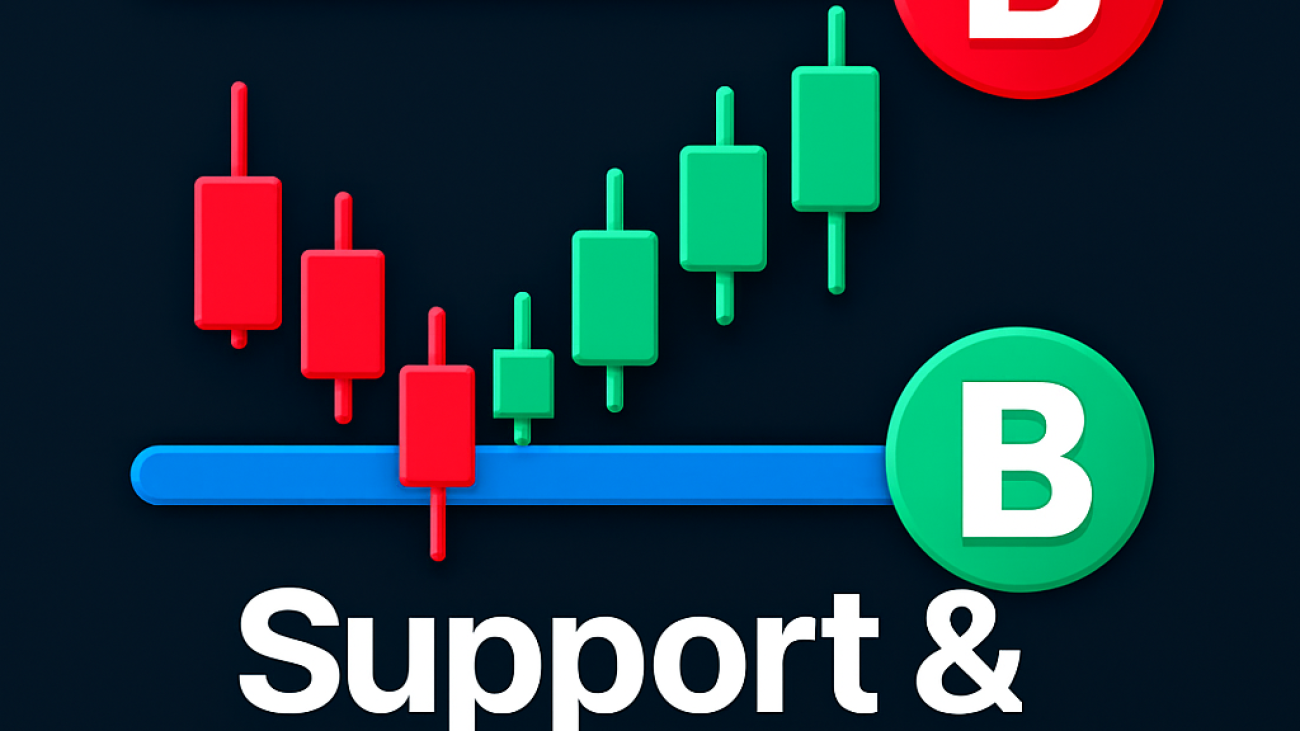
The Support and Resistance Levels Indicator for MetaTrader 5 is one of the most advanced and reliable tools for identifying key price zones in the market. Unlike traditional indicators, it not only detects support and resistance levels but also combines them with volume analysis to generate accurate and high-probability trading signals.
Timeframes: All timeframes (from scalping on lower charts to long-term position trading)
Trading Styles:Scalping – Day Trading – Swing Trading – Position Trading
Settings Overview
Lookback candles – Define how far back the indicator should search for levels
Break detection parameter – Shows all breaks of support and resistance
Swing calculation – Two parameters (right and left bars) to identify market swings
Custom colors – Choose colors for support and resistance lines
Tester options – Built-in tester to analyze past performance
Alerts & notifications – Two parameters to send real-time alerts and push notifications
How It Works
The indicator identifies swings using the right and left bar parameters. When a support or resistance level is broken, it checks whether the volume exceeds the set threshold. If confirmed, the indicator generates a trading signal.
By combining volume confirmation with Smart Money Concepts (SMC), this indicator offers a significant edge compared to standard support and resistance tools. The built-in tester also allows traders to evaluate results over specific periods, making strategy validation faster and more reliable.
Key Benefits
Accurate support and resistance detection based on market swings
Volume confirmation to filter out false breakouts
Fully customizable parameters to adapt to any trading style
Works on all timeframes and for different strategies
Integrated backtesting feature for performance evaluation
Real-time alerts and notifications to never miss a signal
Why Choose This Indicator?
Most support and resistance tools only plot static levels, but this indicator goes further by integrating volume analysis and SMC principles. This makes it suitable for traders who want precise signals for entries, exits, and breakout confirmations.
If you are looking for a complete solution for support and resistance trading in MT5, this indicator is designed to improve your accuracy, save time, and help you trade with confidence.
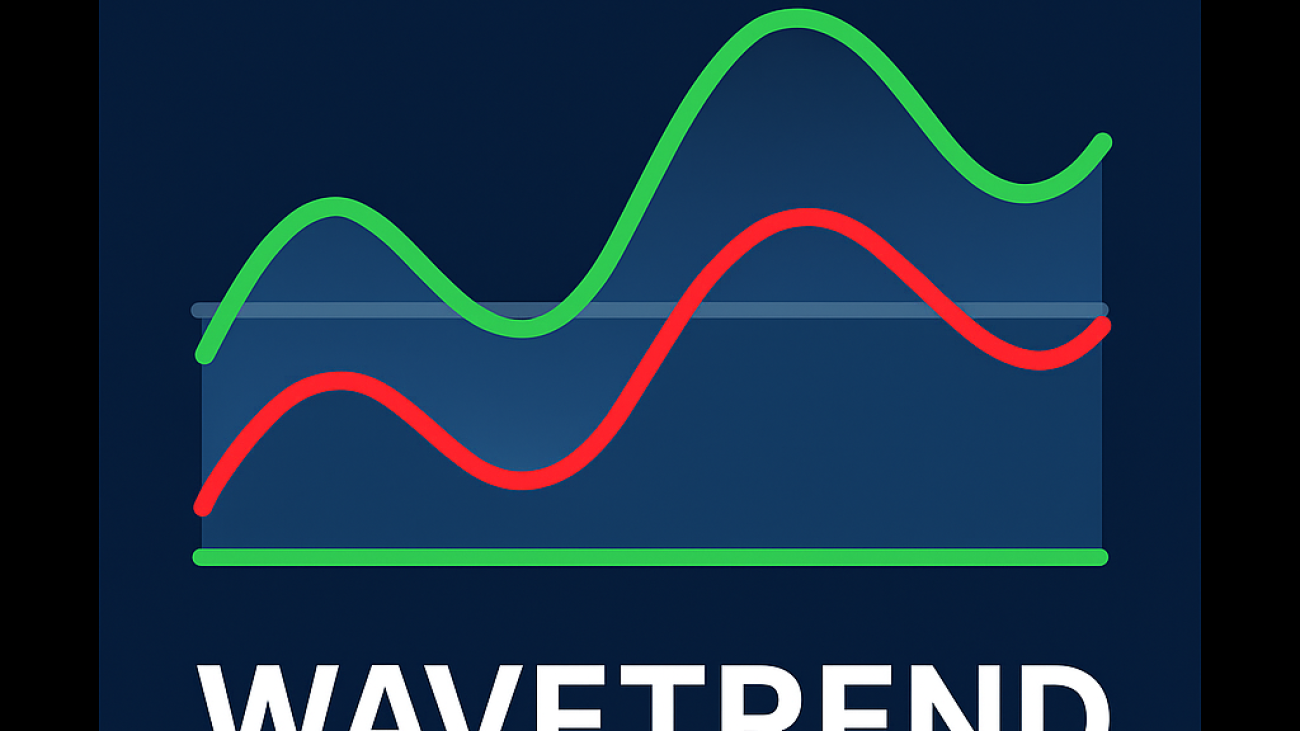
The Wave Trend Oscillator Indicator for MT5 is one of the well known indicators in the market, helping traders find strong entry points into the market. Like any other MetaTrader 5 indicator, it can produce both good and bad signals, but the number of accurate buy/sell signals is significantly higher than the weak ones. This makes it a powerful tool for improving your forex trading strategy, whether you are a beginner or an advanced trader.
How does this indicator work?
This indicator is built from two Exponential Moving Averages (EMA).
When these lines go above 53 and then turn back down, it generates a sell signal.
When they go below -53 and then turn back up, it generates a buy signal.
This simple yet effective logic makes it useful for detecting trend reversals, scalping opportunities, and swing trading setups.
Settings
The settings of this indicator are divided into two main sections:
Calculation settings – for configuring how the oscillator works.
Tester and signal settings – for testing and sending signals in the strategy tester.
How to get the best results from this indicator?
Do not use this indicator as a standalone trading strategy. Instead, integrate it into your personal trading system to find more precise and optimized entry points. Combine it with support and resistance, price action, or other MT5 indicators to maximize performance.
The CM Williams Fix Indicator for MetaTrader 5 is one of the most popular indicators on the TradingView platform, now available for MT5 users. This tool identifies special market conditions and delivers reliable, high-quality buy signals. Simply attach it to your chart and experience its outstanding performance in your trading.
Type: indicator Market: all markets TimeFrames: all timeframes Trading type: all trading types from scalping to position trading
How Does It Work?
This indicator is specifically designed to provide buy signals in the market. It combines calculations from Bollinger Bands and momentum to detect accurate entry points. After the appearance of the gray lines, you will see green lines, and the first green bar indicates a buy signal.
By combining this indicator with your personal trading strategy, you can find excellent entry opportunities and improve your overall trading performance.
Built-in Tester
One of the strongest features of this indicator is the built-in tester panel. It allows you to check how the signals are within a specific period, using your defined stop loss and take profit levels. This feature makes it easy to evaluate the indicator before using it in live markets.
Conclusion
The CM Williams Fix Indicator for MT5 is a powerful tool that helps traders identify buy opportunities with accuracy and confidence. Add it to your charts, combine it with your strategy, and see why it is considered one of the most rated indicator in the market.
The Smart Squeeze Momentum Indicator MT5 is a powerful trading tool that helps traders identify periods of market contraction, expansion, and potential trend reversals. Built on the proven concepts of Bollinger Bands and Keltner Channels, this indicator detects “squeeze” conditions and provides a clear momentum histogram along with buy and sell trading signals.
Key Features
Momentum Histogram – Visualizes the strength and direction of market momentum.
Use True Range – Enable advanced calculation for precise results.
Tester Options – Backtest with start date, take profit (TP), and stop loss (SL) in points.
How It Works
A squeeze condition occurs when Bollinger Bands contract inside the Keltner Channels, signaling low volatility.
When volatility expands, Bollinger Bands break outside the channels, indicating potential momentum shifts.
The histogram color changes according to momentum direction and intensity.
Buy and sell arrows appear when squeeze releases align with momentum confirmation.
Why Traders Use It
Detects high-probability breakout setups in Forex, stocks, indices, and crypto.
Helps capture trend reversals and momentum trades with precision.
Provides clear visual signals for discretionary traders and buffer outputs for automated Expert Advisors (EAs).
Additional Notes
All buffers (histogram, squeeze, buy, and sell) are fully available for EA integration.
Designed for analytical and educational purposes – does not guarantee profits.
Compatible with the MetaTrader 5 (MT5) platform.
Perfect for traders looking to master volatility breakouts, improve momentum trading strategies, and combine Bollinger Band squeeze setups with automated or manual trading systems.
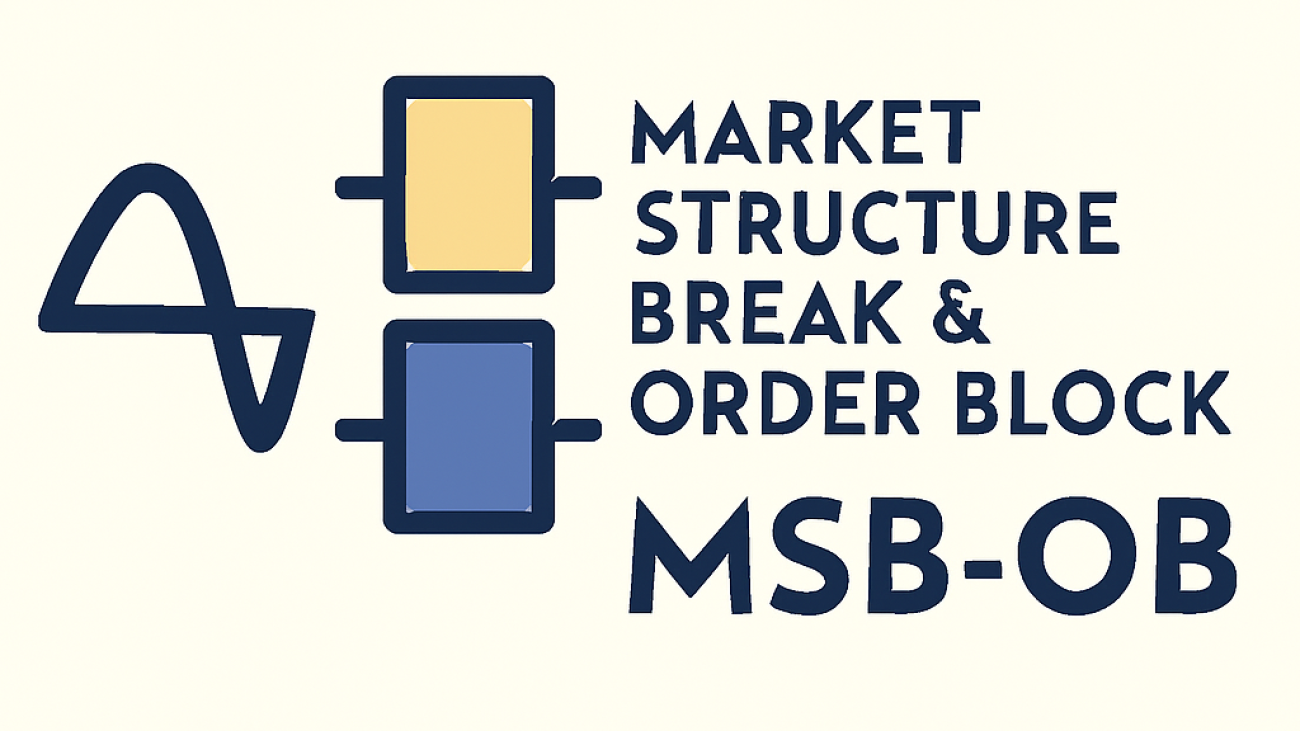
The Market Structure Break & Order Block (MSB-OB) indicator is built to analyze price structure, highlight market structure breaks, and mark order block zones. It also provides buffers for Buy/Sell signals and MSB detection, making it suitable for both manual analysis and automated strategies. A tester panel is included to evaluate performance under different conditions in the Strategy Tester.
Main Concept
Market Structure Break (MSB): Occurs after price breaks an old high and then forms a lower low, or after price breaks an old low and then forms a higher high.
Order Blocks (OB): Appear after MSB. If the MSB is bearish, the OB is the last bullish candle before the high. If the MSB is bullish, the OB is the last bearish candle before the low.
Breaker and Mitigation Blocks: These are blocks formed in the low area before the last high (bearish case) or in the high area before the last low (bullish case). The last bearish candle for bearish, and the last bullish candle for bullish, act as mitigation or breaker blocks.
Features
Buy/Sell signal buffers for easy EA integration.
MSB buffers for automated detection of structure breaks.
Order block, breaker, and mitigation zones displayed directly on the chart.
ZigZag-based structure with adjustable parameters.
Tester panel to experiment with settings in the Strategy Tester.
Fully customizable colors, widths, and label sizes.
Inputs
ZigZag Length – swing point sensitivity.
Show ZigZag – option to show or hide ZigZag lines.
Fib Factor – fib-level confirmation for breakouts. Example: if a new high is larger than the old high-to-low × (1 + Fib Factor) during a downtrend, then it is considered a breakout.
Colors and Styles – order block, breaker block, and MSB visualization.
Font Size / Line Width – for labels and lines.
Notes
Signal and MSB buffers are available for automation.
Tester panel allows performance evaluation under different market conditions.
All input parameters, output messages, and descriptions are provided in English.
The indicator is intended for analytical use and does not guarantee or promise trading results.


")
")
")


")
")
")
")
")
")
")
")
")
")
")
")
")
")
")
")
")
")
")
")
")
")
")
")


