PMax Indicator MT5: Settings, Signals and a Gold Walkthrough
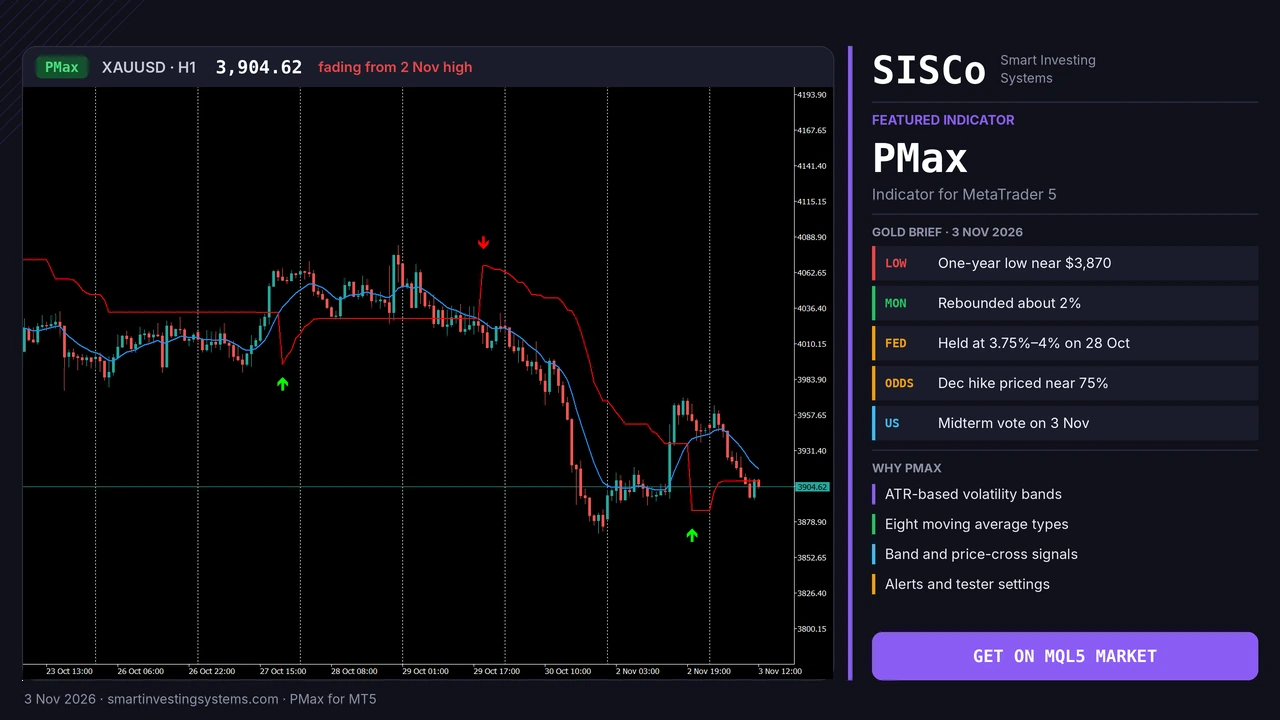
Gold dropped to a one-year low near $3,870 on Friday, jumped about 2% on Monday and slipped again today. In a market like that, a fixed stop is either too tight or too wide, and a plain moving average keeps changing its mind. The PMax indicator for MT5, also known as Profit Maximizer, tackles this by combining a moving average with ATR, so the distance it allows changes with volatility. This guide explains how PMax works, how to read its two signal types, which settings to test, and how to run a simple test on XAUUSD yourself.
01What the PMax Indicator Does
The PMax Indicator for MT5 plots a red band and a blue band on your chart, built from ATR (Average True Range) and a moving average you choose. It can signal in two ways: when the two bands cross, or when price crosses the red band. You can turn on either signal type, or both.
Moving average
Follows direction. You choose from eight types: SMA, EMA, WMA, TMA, VAR, WWMA, ZLEMA and TSF, and you set the length.
ATR
Measures volatility. You set the ATR Period and Multiplier, switch between two calculation methods, and can normalize the ATR.
Signals and alerts
Band-crossing and price-crossing signals can be switched on separately, with alert settings and tester settings built in.
Most ATR trend tools use one fixed average. The value of PMax is that the same logic can be tuned very differently for gold, a major forex pair or an index, simply by changing the average and how ATR is handled.
02Why ATR Matters for a Trend Tool
ATR tells you how far price has typically been moving per bar. Multiply it by a chosen number and you get a distance that grows when the market is wild and shrinks when it is calm. That is why the PMax band can act as a volatility-aware trailing stop, instead of a stop placed a fixed number of points away.
Here is a simple made-up example. If ATR reads 20 points and your Multiplier is 3, the distance is 60 points. If volatility doubles and ATR reads 40, the same setting gives 120 points. The stop now has more room, but it is also twice as far away.
A wider stop means you should trade a smaller size. In the example above, keeping the same money at risk means cutting the lot size in half when the distance doubles. Volatility-based stops only protect you if your position size follows them.
03How to Read PMax Buy and Sell Signals
PMax gives you two signal types, and they fire at different times. It helps to think of them as two separate rules and test them one at a time.
📈 Bullish signal
- The red and blue bands cross in the buy direction.
- Or, with price crossing enabled, price crosses the red band from below.
- Stronger context: the higher timeframe is also pointing up.
📉 Bearish signal
- The red and blue bands cross in the sell direction.
- Or, with price crossing enabled, price crosses the red band from above.
- Stronger context: the higher timeframe is also pointing down.
Band crossings show the two lines changing places, which suits traders who want one clear change of direction. Price crossings react to price itself, so test whether they suit you better for entries or for managing a trade that is already open. Neither one tells you where to place a target, so decide your exit rules before you start testing.
04PMax Settings to Test
The values below are starting points to test on your own broker’s data. They are not the indicator’s defaults and they are not recommendations. Change one setting at a time so you can see what it actually does.
| Setting | What it controls | Starting point to test | Try changing it when |
|---|---|---|---|
| Source | The price used in the calculation | Close | You want to compare a smoother price input |
| ATR Period | How many bars ATR measures | 10 | The bands react too quickly or too slowly to volatility changes |
| Multiplier of ATR | The distance allowed by the bands | 3 (compare 2 and 4) | You get too many flips (raise it) or very late signals (lower it) |
| Moving Average Type | How direction is smoothed | EMA | You want to compare a faster or smoother average |
| Moving Average Length | How much history the average uses | 10 | You move to a higher or lower timeframe |
| ATR Calculation Method | Which of the two ATR methods is used | Compare both | Results differ noticeably on your symbol |
| Normalize the ATR | Whether ATR is normalized | Off, then compare with on | You want to tune the same logic across different instruments |
| Signals | Band crossing and price crossing | Band crossing only at first | You are ready to test price crossing as a separate rule |
The average you pick changes the character of the indicator more than most traders expect:
- Quicker to react: EMA, WMA and ZLEMA put more weight on recent prices or try to reduce lag.
- Smoother: SMA and TMA respond more slowly, which can suit calmer swing trading.
- Others worth comparing: VAR, WWMA and TSF each smooth price in their own way, so test them rather than assuming they behave alike.
05A Live Example: Gold Near $3,900
Gold is a useful test case right now because its swings are large and the news flow is heavy:
- The low: spot gold fell to about $3,870 on Friday 30 October, its lowest level since October 2025, according to The Deep Dive.
- The bounce: gold rose about 2% on Monday as falling oil prices eased inflation worries.
- Today: spot gold was around $3,926 early on Tuesday 3 November, down 0.5%, as traders waited for the US midterm elections, reported Business Recorder.
- The Fed: traders price roughly a three-in-four chance of a December rate hike on CME FedWatch, with the two sources above showing 74% and 76.6%.
For a PMax user, the practical points are simple. A stop distance that felt right before this drop may be too tight now, and a higher ATR reading shows that directly. The roughly $3,870 low and the round $4,000 level are the two prices many traders are watching, so note where PMax signals appear relative to them. With the election today and US jobs data later this week, expect sudden moves, and consider treating any signal around a major release with extra caution.
The chart at the top of this article shows PMax on XAUUSD H1. A buy arrow appeared on 27 October as price pushed above the bands, and a sell arrow followed on 29 October, ahead of the sharp slide into Friday’s low. A new buy arrow printed on 2 November after the rebound, but price has since slipped back to about $3,904, below the blue line and close to the red band. That is a good reminder that a signal in a fast market can be tested quickly, so your stop and position size matter as much as the arrow.
06Step by Step: Test PMax on XAUUSD
Load the free demo
Download the demo from the MQL5 Market and run it in the MetaTrader 5 Strategy Tester on XAUUSD H4.
Enter one baseline
Use the starting values from the table, with band-crossing signals only. Write them down so every test starts from the same place.
Log every signal
Cover calm periods as well as October’s sharp fall. Record the date, direction, ATR reading and what price did next.
Change one thing
Compare the Multiplier at 2, 3 and 4, then compare two or three moving average types. Change nothing else during each comparison.
Add rules, then go to demo
Decide your stop, exit and position size rules, then forward test on a demo account before you risk real money.
Include spreads in your testing. Gold spreads can widen around major news, and a result that only works with perfect fills is not a result you can rely on.
07Common Mistakes With PMax
Optimizing until the past looks perfect. Settings fitted tightly to one stretch of data often fail on the next one.
Keeping the same lot size while the ATR distance grows. Your money at risk rises even though the setting did not change.
Trading every crossing in a sideways market. Like any trend tool, PMax can flip repeatedly when price has no direction, so use a higher timeframe to check the context.
Testing both signal types at once. If they are mixed together you cannot tell which rule is helping and which is hurting.
If you like this style of tool, compare it with the related Stochastic OTT Indicator and the OTTO Indicator. Once you have rules you trust, SISCo can turn them into an Expert Advisor through our custom EA service.
08PMax Indicator FAQ
What does PMax stand for?
PMax is short for Profit Maximizer. The name describes the tool, not a result. Like any indicator, it cannot guarantee a profit.
Which moving averages can PMax use?
Eight types: SMA, EMA, WMA, TMA, VAR, WWMA, ZLEMA and TSF. You choose the type and the length in the settings.
Can PMax be used as a trailing stop?
Yes. Its ATR-based band can act as a volatility-aware stop, moving with market conditions rather than sitting at a fixed distance. Test how it behaves on your symbol and timeframe before relying on it.
Is there a free demo of the PMax indicator?
Yes. You can download a free demo from the MQL5 Market and run it in the MetaTrader 5 Strategy Tester before buying.
Test PMax on Your Own Charts
Choose your moving average, set your ATR distance and see how PMax handles a volatile market like today’s gold. Start with the free demo and judge it on your own data.
Trading involves risk and you can lose money. This article is for education only and is not financial advice.
Gold · indicators · mt5 · PMax · Trend
Related articles
Heikin Ashi RSI MT5: How to Read HARSI Candles (Gold Guide)
Learn how the Heikin Ashi RSI (HARSI) indicator for MT5 turns RSI into smooth candles, which settings to test, and how to read it…
Read more →
Trend Strength Index MT5: Is Gold’s Rebound Steady Before CPI?
Learn how the Trend Strength Index for MT5 shows how steady gold's rebound is before US CPI, with settings, signals and a step-by-step plan.…
Read more →
Convert MT4 EA to MT5: What OANDA’s MT4 Shutdown Means
Convert MT4 EA to MT5 before brokers like OANDA Japan switch off MT4. Learn what changes in MQL5, how to test it, and get…
Read more →Need a team that can design, build and maintain it all?
Let's talk. Tell us about your project and we'll reply with honest timelines.