Order Block Indicator MT5: Gold’s Midterm Jump Above $4,000
Gold jumped back above $4,000 on Wednesday after Democrats took control of Congress, only days after a one-year low near $3,870. Anyone watching XAUUSD now has the same question: is this a real change in market structure, or a news spike that fades into Friday’s payrolls? An order block indicator for MT5 cannot predict that, but it does give you an objective test. Did price break structure decisively, and where did the move begin? This guide uses the SISCo Market Structure Break & Order Block (MSB-OB) indicator to show how to read gold’s jump, what to watch this week, and how to plan a retest instead of chasing a candle that has already run.
Every setting and rule below is a starting point to test on your own broker’s data, not a promise of results.
01What Pushed Gold Above $4,000
The facts matter here, because they explain why this move is both tradable and fragile:
- The move: Reuters reported spot gold up 3% at $4,046.91 by 09:28 GMT on 4 November, with December futures at $4,057.20. Saxo had gold around $4,035 in its morning note.
- The trigger: the dollar fell after Democrats won the House and Senate, and a softer dollar makes gold cheaper for buyers holding other currencies. US Treasury yields also dropped a few basis points.
- The rest of the metals: silver rose 4.4% to $51.99 and platinum rose 3.2%, so the buying was not limited to gold.
- The backdrop: gold fell to a one-year low near $3,870 on 30 October. The Fed held rates at 3.75%–4.00% last week, and Reuters cited an 83% chance of a December hike on CME FedWatch.
That last point is the tension in this trade. Hamad Hussain of Capital Economics told Reuters the Fed is likely to stay hawkish, so “the scope for further gains in gold prices is limited.” Buyers have a fresh reason to own gold, while higher rates remain a real headwind. A structure tool helps because it does not need you to settle that debate. It only asks what price has actually done.
02Why a Round Number Is Not a Structure Break
Headlines say gold “reclaimed $4,000”, but that level is a psychological line, not a swing point. Market structure is defined by swings: higher highs and higher lows in an uptrend, lower highs and lower lows in a downtrend. A market structure break (MSB) is the moment that sequence fails.
Saxo’s note separates the levels well. Gold cleared resistance at $3,970, and at around $4,035 it was close to a downtrend line in place since August. That gives traders three different questions:
- Round number: can gold hold above $4,000 on a closing basis?
- Prior resistance: does $3,970 now act as support if price dips?
- Longer trend: does the rally clear the August downtrend, or stall beneath it?
Only a decisive break of the last lower high changes the swing sequence itself. That is the event MSB-OB is designed to detect, and it separates market structure break gold setups from simple headline spikes.
03How the Order Block Indicator MT5 Confirms a Break
The MSB-OB indicator works in three stages. A ZigZag with an adjustable ZigZag Length maps the swing highs and lows. It then measures any break against the previous swing, and a break only counts when price extends past that swing by a margin set by the Fib Factor. Once a break is confirmed, it labels the MSB and draws the related zones.
A worked example, using round numbers rather than a reading from a live chart: suppose the last swing on your chart ran from a lower high of $3,970 down to the $3,870 low, a $100 swing. With a Fib Factor of 0.3, price must clear the old high by 30% of that swing, or $30, before a bullish MSB is confirmed. That puts the trigger above $4,000. A rally that stalled at $3,985 would be ignored. Your own ZigZag may pick different swings, so always read your chart rather than these figures.
Order block
After a bullish MSB, this is the last bearish candle before the low. It marks where the move that broke structure began, and price often returns to it.
Breaker block
A zone formed on the opposite side of the structure. It shows where earlier positions may be defended or closed when price comes back.
Mitigation block
Another opposite-side zone, drawn to show where traders may manage earlier positions on the return to that area.
Notice what the example implies. If the order block sits near the $3,870 low and gold trades above $4,000, a higher-timeframe block could be well over $100 from price. A stop beyond it would be wide. That is why the routine below uses the higher timeframe for bias and a lower timeframe for entries.
04Reading Gold’s Jump: Bullish vs Bearish Cases
Before you take a side, write down what would prove each case right. Here is one way to frame it on XAUUSD:
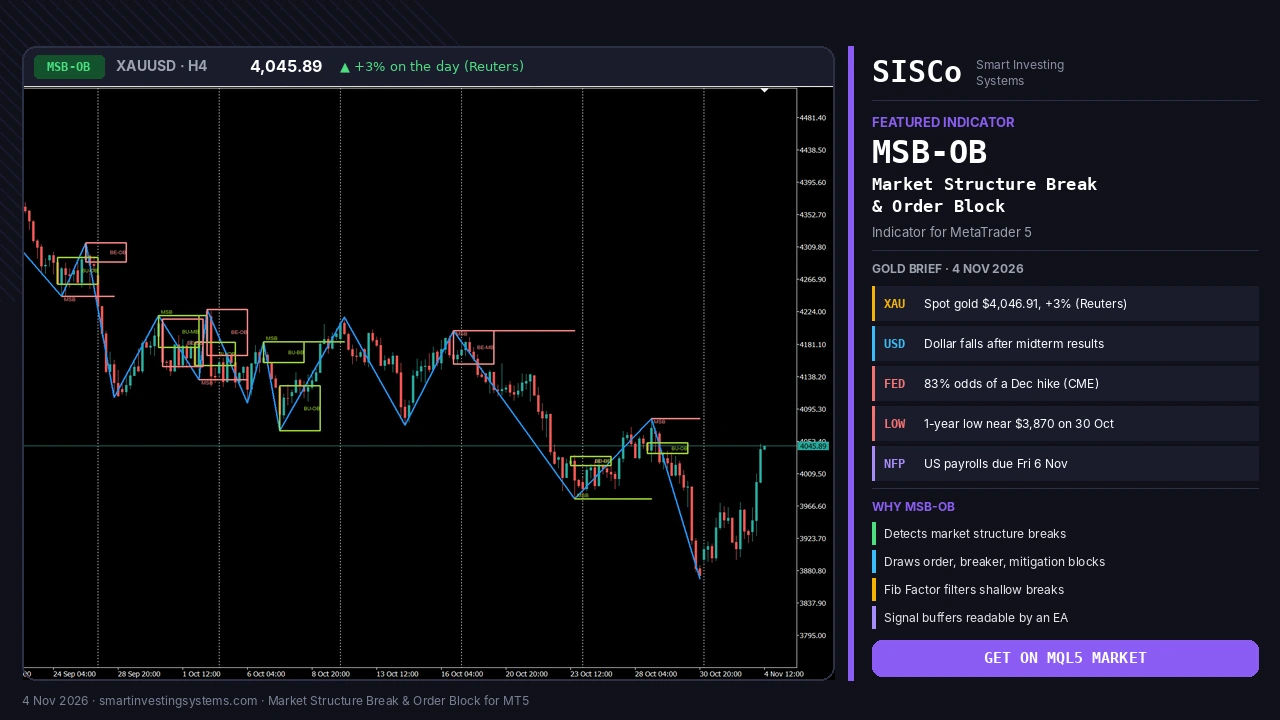
What the H4 chart shows: on the XAUUSD H4 chart with MSB-OB, gold stepped down in a series of lower swing highs from mid-September, and the indicator labelled the breaks along the way. The fall into the 30 October low near $3,875 was sharp, and the latest H4 candles climb back to 4,045.89, close to a green BU-OB box. The red MSB line from the late-October swing high, near $4,085, sits just above that price and has not been cleared on this chart. That is why it makes sense to wait for a confirmed break and a retest rather than treat the jump as settled.
📈 Bullish signal
- A bullish MSB is labelled on H4 or Daily
- Price pulls back into the order block drawn after the break
- A reversal candle forms at the block on a lower timeframe
- $3,970 holds as support on any dip
📉 Bearish signal
- No bullish MSB appears despite the headline jump
- Price stalls under the August downtrend
- Gold falls back below $3,970
- A bearish MSB prints on M15–H1 against the rally
To keep the key prices in view, you can add the Support and Resistance Levels indicator alongside MSB-OB. If you also want continuation breaks marked, compare the Market Structure CHoCH/BOS indicator, which labels both BOS and CHoCH signals. MSB-OB focuses on the reversal type of break and adds the Fib Factor filter.
05A Step-by-Step Retest Routine for This Week
This routine follows the framework on the product page. It is a process to test, not a guaranteed system.
Set the bias
Open XAUUSD on H4 or Daily and note the direction of the most recent MSB. If there is no bullish MSB yet, treat the rally as unconfirmed.
Mark the levels
Draw $3,970, $4,000 and your own version of the August downtrend, so you can see where price is reacting.
Drop to M15–H1
Wait for an MSB in the same direction as your higher-timeframe bias. Ignore breaks that fight it.
Wait for the retest
Do not enter on the break itself. Let price return to the order block drawn after the MSB.
Look for a reaction
Enter only if price rejects the block, for example with a reversal candle. Place the stop beyond the block and target the next opposing swing or zone.
Test it first
Run the same rules in the MT5 Strategy Tester on your own symbol, and check how they behave on data days before risking money.
06Starting Settings for XAUUSD
The product page explains how each input behaves, so use these only as starting points to test. They are not proven settings, and your broker’s gold feed may need something different.
| Setting | What it controls | H4/Daily bias (starting point) | M15–H1 entries (starting point) |
|---|---|---|---|
| ZigZag Length | How sensitive swing detection is | Raise it to focus on larger structure | Lower it for faster, shorter-term structure |
| Fib Factor | How far price must go beyond the prior swing | Try 0.3, the page’s example, and raise it if false breaks appear | Try 0.3, then lower it only if breaks arrive too late |
| Show ZigZag | Shows or hides the swing lines | On while you learn the swings | Off if the chart gets busy |
| Colors, line width, font size | Chart readability | Set for clear labels | Set for clear labels |
A lower ZigZag Length or Fib Factor reacts faster but flags more weak signals. A higher one is slower but filters noise. Change one input at a time so you can see what each change does.
07Event-Week Traps to Avoid
The first candle is not the signal. A jump on election news can look like a break before the swing logic confirms anything. Wait for the label.
The calendar is crowded. ADP and ISM services are due Wednesday, the Bank of England decides Thursday, and US payrolls land Friday. Any of them can reverse the move.
Zones can fail. An order block is a place to watch, not a wall. Decide in advance what would prove the idea wrong.
Stop distance matters. Gold can move far in a day, so size your position from the distance to your stop, not from the entry alone.
If you want this routine to run by rule, MSB-OB exposes Buy/Sell signal buffers and MSB buffers that an Expert Advisor can read with iCustom. SISCo can build a custom EA around your own entry and risk rules, including alerts, multi-timeframe logic or extra filters.
08Frequently Asked Questions
What is an order block indicator for MT5?
It is a tool that marks the candle zone where a structure-breaking move began. MSB-OB first confirms a market structure break, then draws the order block, breaker block and mitigation block linked to it.
Why did gold rise above $4,000 on 4 November 2026?
Reuters linked the jump to a softer dollar after Democrats won control of Congress, with analysts also pointing to fiscal concerns. Treasury yields fell a few basis points on the same morning.
Does a bullish MSB mean gold will keep rising?
No. It shows that price broke the previous swing sequence by your chosen margin. It says nothing certain about the next move, and a hawkish Fed or strong payrolls could still push gold lower.
Can I try MSB-OB before buying?
Yes. You can download a free demo from the MQL5 Market and run it in the MetaTrader 5 Strategy Tester.
Plan the Retest, Don’t Chase the Headline
MSB-OB shows whether a move really broke structure and where it began, so you can plan your entry on gold or any other symbol before the next data release. Try the free demo, then test your own rules.
Trading involves risk and you can lose money. This article is for education only and is not financial advice.
Gold · indicators · Market Structure · mt5 · Order Block
Related articles
Heikin Ashi RSI MT5: How to Read HARSI Candles (Gold Guide)
Learn how the Heikin Ashi RSI (HARSI) indicator for MT5 turns RSI into smooth candles, which settings to test, and how to read it…
Read more →
Trend Strength Index MT5: Is Gold’s Rebound Steady Before CPI?
Learn how the Trend Strength Index for MT5 shows how steady gold's rebound is before US CPI, with settings, signals and a step-by-step plan.…
Read more →
Convert MT4 EA to MT5: What OANDA’s MT4 Shutdown Means
Convert MT4 EA to MT5 before brokers like OANDA Japan switch off MT4. Learn what changes in MQL5, how to test it, and get…
Read more →Need a team that can design, build and maintain it all?
Let's talk. Tell us about your project and we'll reply with honest timelines.