Impulse MACD MT5: Reading Gold’s Rebound From a One-Year Low
Gold just had its worst October since 2008, hit a one-year low below $3,900 on Friday, and bounced on Monday. Every trader looking at XAUUSD now has the same question: is this bounce real strength, or a pause before the next leg down? The Impulse MACD indicator for MT5 is built to help with that question. It shows whether momentum is strengthening or weakening, and it stays flat when price is only drifting inside a channel. This guide explains how it works, what to check on gold this week, and a simple routine you can test yourself.
Every setting and rule below is a starting point to test on your own broker’s data, not a promise of results.
01Why Gold’s Bounce Is a Momentum Question
The facts behind the move matter, because they explain why ordinary signals are hard to trust right now:
- The drop: gold fell more than 3% on Friday 30 October to a one-year low near $3,870, and closed the week around $3,875. InvestingLive puts it about 30% below its January record.
- The month: gold lost about 6% in October, its worst October since 2008, according to XTB.
- The cause: a tech selloff, including Intel’s drop of nearly 30%, may have triggered margin calls, and investors sold liquid assets such as gold to cover them. Rate fears added to the pressure: the Fed held at 3.75%–4.00% with two officials voting for a hike, and markets price roughly a 70%–75% chance of a December hike.
- The bounce: gold climbed back to around $3,900 on Monday 2 November as oil fell, with Brent back below $110 on Iran diplomacy, easing inflation worries.
Notice what is unusual here. Part of Friday’s fall looks like forced selling, not a calm change of opinion. Treasury yields fell and the dollar softened on the same day, which would normally help gold. When price moves for mechanical reasons, the first bounce can be just as mechanical. You need a way to judge the strength behind the move, and that is what a momentum tool is for.
02What the Impulse MACD Indicator Shows
The Impulse MACD indicator for MetaTrader 5 is a momentum tool that sits in a subwindow below your chart. It has three parts:
Colour-coded histogram
Four colours show four momentum states: strengthening or weakening, in either direction.
Signal line
A smoothed line that the histogram crosses. This crossing is the indicator’s main trigger.
Buy and sell arrows
Marked when the histogram crosses the signal line, and also available as buffers an EA can read.
It also includes alerts, push notifications and a built-in tester, and it works on all symbols and timeframes.
03Impulse MACD vs Classic MACD
A classic MACD compares two moving averages of price. That makes it slow, and in a range its lines keep crossing. Impulse MACD works differently. It compares a zero-lag mid-price line with smoothed high and low channels, so it only registers momentum when price pushes outside that channel.
| Feature | Classic MACD | Impulse MACD |
|---|---|---|
| What it compares | Two moving averages of price | Zero-lag mid-price vs smoothed high-low channel |
| Speed | Slower, because of its averages | Zero-lag calculations react faster |
| In sideways markets | Lines keep crossing | Stays flat while price is inside the channel |
| Momentum states | Above or below zero, plus histogram size | Four colours for strengthening or weakening |
| Signals on chart | You read the crossover yourself | Buy and sell arrows, alerts and push notifications |
The flat reading matters most after a shock like Friday’s. If gold chops around $3,900 for days, a classic MACD may keep producing crossovers, while Impulse MACD is designed to stay quiet until price actually leaves its channel.
04Reading the Four Momentum States on XAUUSD
Think of the colours as answering two questions at once: which direction is momentum pointing, and is it growing or fading? For the current gold chart, that gives you a clear way to frame the bounce.
📈 Signs the bounce has strength
- Histogram shifts from weakening bearish into bullish states
- Histogram crosses above the signal line
- Bullish momentum keeps strengthening as price tests $4,000
📉 Signs the bounce is fading
- Bearish momentum only weakens, then strengthens again
- Histogram crosses below the signal line near resistance
- Bullish momentum weakens before price reaches $4,000
A weakening bearish state is not a buy signal by itself. It only says the selling pressure is slowing. After a liquidation, that is often the first thing to change, and price can still fall again. Treat colour changes as information, and the histogram crossing the signal line as the trigger you test.
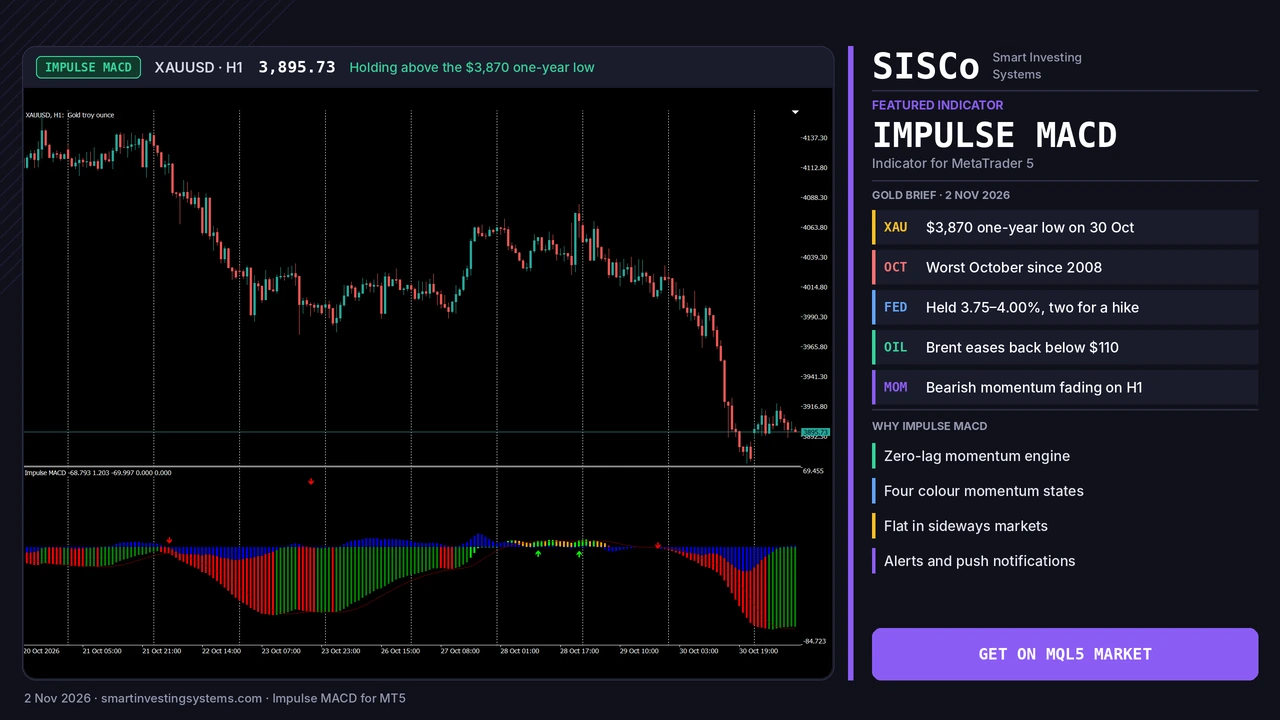
The banner above shows Impulse MACD on XAUUSD H1. A red sell arrow appeared late on 29 October with price still above $4,000, before the final drop to Friday’s low near $3,870. The red histogram bars deepened during that slide, turned dark green around the low, and stayed green through Monday’s bounce to about $3,895. The histogram is still far below zero and no buy arrow has appeared, which matches the picture above: selling pressure has eased, but the indicator has not confirmed a reversal. This is one chart at one moment, not evidence of future results.
05Gold Levels and Dates to Watch This Week
Momentum means more when you know where price is and what news is coming. These are the levels analysts have been pointing to, and they make a useful map for your own chart:
- $3,870: Friday’s low, the first level sellers need to break.
- $3,886: the support Standard Chartered flagged, which gold closed below on Friday. Reclaiming and holding it would be a first small sign of repair.
- $3,800: the next round support if the low gives way.
- $4,000: the big psychological level, and the line several analysts say gold must regain to steady the short-term picture.
To mark them with less manual work, the Support and Resistance Levels indicator finds levels from market swings and shows when they break. If you want a separate read on panic, the CM Williams Vix Fix flags fear spikes from price data.
Then check the calendar, because news can overwhelm any indicator:
Tue 3 Nov: US midterm elections. Wed 4 Nov: ADP employment. Thu 5 Nov: Bank of England decision.
Fri 6 Nov: US jobs report after a weak +29,000 in September. Tue 10 Nov: US CPI. Both will test December hike bets.
06Impulse MACD Settings to Test
The indicator has two core inputs, plus a tester section. MA Length controls the smoothing of the high and low channels, and Signal Length controls the smoothing of the signal line. Begin with the indicator’s default lengths, then compare them with the values below. These are suggested starting points to test on your own data, not the product’s defaults or proven settings.
| Timeframe | MA Length (test range) | Signal Length (test range) | Trade-off to look for |
|---|---|---|---|
| M15 | 20–30 | 7–9 | More signals, more noise around news |
| H1 | 30–40 | 9–12 | A balanced view for this week’s swings |
| H4 | 30–50 | 9–14 | Fewer signals, wider stops needed |
In the tester section, Take Profit and Stop Loss are set in points. Check how many digits your broker quotes on XAUUSD first, because the same number of points can mean a very different dollar distance. Gold’s recent daily ranges have been large, so a stop that worked in a calm month may be far too tight now.
07Step by Step: An Impulse MACD Routine for Gold
Start with the higher timeframe
Open XAUUSD on H4 and note the momentum state. After a fall this sharp, it tells you whether you are trading with the bigger move or against it.
Mark your levels
Add $3,870, $3,886, $3,800 and $4,000, and update them with what your broker’s feed shows.
Drop to H1 and watch the colours
Is bearish momentum still strengthening, or is it weakening? Is any bullish state appearing, and is it growing?
Wait for the crossover near a level
Use the histogram and signal line cross as your trigger, and set alerts so you do not have to watch the screen. Avoid acting in the minutes around the jobs report.
Size for this volatility and review
Base your stop on current ranges, reduce your size if needed, and log each signal. Use the built-in tester to compare settings on history.
A word on the tester: it shows buy and sell counts, win and loss results and a total win rate for the period and settings you choose. That is useful for comparing ideas, but the results depend on your inputs and data, and they do not predict how the market behaves next.
08Common Mistakes and How to Automate the Process
Treating fading selling as buying
A weakening bearish state means less pressure, not a reversal. Wait for your actual trigger.
Ignoring the calendar
Jobs and CPI data can jump past any level. Decide your plan before the release.
Using old stop sizes
Volatility has changed. Re-test your Take Profit and Stop Loss values on recent data.
Using it alone
Combine it with price structure, volatility filters or a trend tool, as the indicator’s own guide suggests.
Because Impulse MACD is fully buffer-based, an Expert Advisor can read its signals. If you want rules like “only trade H1 crossovers that agree with H4 momentum, and pause around news” to run automatically, you can build a custom EA around them, with your own risk limits.
Frequently Asked Questions
What is the Impulse MACD indicator?
It is a momentum indicator that compares a zero-lag mid-price line with a smoothed high-low channel. It colours its histogram in four momentum states and gives buy and sell signals when the histogram crosses its signal line.
Is Impulse MACD better than a normal MACD?
It is different rather than automatically better. It reacts faster and stays flat in sideways markets, where a classic MACD keeps crossing. Test both on your own market and timeframe to see which suits you.
Can I use Impulse MACD on gold?
Yes. It works on all symbols and timeframes, including XAUUSD. Because gold is volatile right now, test your settings and stop distances on recent data first.
Is there a free demo?
Yes. You can download a free demo from the MQL5 Market and run it in the MetaTrader 5 Strategy Tester before buying.
Try Impulse MACD on Your Own Gold Chart
Download the free demo, run it on XAUUSD in the Strategy Tester, and see how its momentum states behaved through October’s slide before you decide. Alerts and push notifications help you catch the next signal without watching the screen.
Trading involves risk, and you can lose money. This article is educational and is not financial advice.
Gold · Impulse MACD · indicators · MACD · mt5
Related articles
Heikin Ashi RSI MT5: How to Read HARSI Candles (Gold Guide)
Learn how the Heikin Ashi RSI (HARSI) indicator for MT5 turns RSI into smooth candles, which settings to test, and how to read it…
Read more →
Trend Strength Index MT5: Is Gold’s Rebound Steady Before CPI?
Learn how the Trend Strength Index for MT5 shows how steady gold's rebound is before US CPI, with settings, signals and a step-by-step plan.…
Read more →
Convert MT4 EA to MT5: What OANDA’s MT4 Shutdown Means
Convert MT4 EA to MT5 before brokers like OANDA Japan switch off MT4. Learn what changes in MQL5, how to test it, and get…
Read more →Need a team that can design, build and maintain it all?
Let's talk. Tell us about your project and we'll reply with honest timelines.