Heikin Ashi RSI MT5: How to Read HARSI Candles (Gold Guide)
A plain RSI line is jumpy. On gold it can cross 70 or 30 several times in one session, and most of those crosses mean nothing. The Heikin Ashi RSI MT5 indicator (often called HARSI) smooths that out: it turns RSI values into Heikin Ashi candles in a separate window, so you can see momentum building or fading at a glance. This guide explains how HARSI candles are built, how its buy and sell signals work, which settings to test first, and how to read it on gold this week, with prices near $4,120 and US inflation data due.
01What the Heikin Ashi RSI indicator is
The Heikin Ashi RSI Indicator for MT5 combines two familiar tools. The Relative Strength Index measures momentum on a 0–100 scale. Heikin Ashi is a candle-smoothing method that averages price data so trends show as runs of same-coloured candles instead of a noisy zig-zag.
HARSI applies the Heikin Ashi calculation to the RSI values themselves, not to price. The result is a sub-window with RSI-based candles, with bodies and wicks, plus the standard RSI line drawn alongside for confirmation. You get a dual view: the candles show the direction and strength of momentum, and the line shows exactly where RSI sits against your overbought and oversold levels.
RSI candles
Heikin Ashi smoothing applied to RSI, shown as candles in a separate window.
RSI line
The normal RSI stays visible, so the indicator does not replace your usual reading.
Signals and alerts
Buy and sell signals on overbought/oversold crosses, with optional alerts and push notifications.
02How HARSI candles are built, and why they are smoother
Standard Heikin Ashi candles use averages instead of raw prices. In general terms, each candle’s close is the average of the bar’s open, high, low and close, and each candle’s open is the midpoint of the previous Heikin Ashi candle’s body. Because every candle carries part of the one before it, short spikes are absorbed and genuine runs stand out.
HARSI applies the same idea to RSI readings. A sudden one-bar jump in RSI that would create a sharp spike on the line becomes a small candle that barely changes colour. A steady climb in momentum becomes a run of rising candles with small lower wicks. That is the practical benefit: fewer false impressions of momentum and an easier read of whether a move is gaining or losing strength.
The indicator also lets you tune the Heikin Ashi smoothing itself. More smoothing gives calmer candles and fewer signals. Less smoothing reacts faster but lets more noise through. There is no single right setting; it depends on the market and timeframe you trade.
03Reading HARSI buy and sell signals
The signal rules come straight from the product description. Signals fire when RSI crosses the overbought and oversold thresholds you set, which makes HARSI a reversal-from-extremes tool, with the candles helping you judge whether the turn has real momentum behind it.
📈 Bullish signal
- RSI crosses back above the oversold level: this is the indicator’s buy signal.
- Look for HARSI candles turning from falling to rising, with small lower wicks.
- Stronger when price is also holding a support area on the main chart.
📉 Bearish signal
- RSI crosses back below the overbought level: this is the indicator’s sell signal.
- Look for HARSI candles turning from rising to falling after a stretched run.
- Stronger when price is stalling at resistance or after a fast spike.
One useful habit: treat the signal as the trigger and the candles as the filter. If RSI crosses up from oversold but the HARSI candles are still printing falling bodies, momentum has not turned yet. Waiting one or two bars for the candle colour to agree costs a little price but often avoids the weakest signals.
04Heikin Ashi RSI settings to start with
The indicator lets you adjust RSI length, price source, Heikin Ashi smoothing and the overbought/oversold levels. The table below lists starting points to test, not recommendations or product defaults. Run each idea in the MT5 Strategy Tester on your own symbol before using it live.
| Setting | Starting point to test | Why you might change it |
|---|---|---|
| RSI length | 14 (the classic RSI period) | Shorter reacts faster but adds noise; longer is calmer but later. |
| Price source | Close | Some traders test a median or typical price for smoother input. |
| Overbought / oversold | 70 / 30 on a 0–100 scale (about +20 / −20 if your sub-window plots RSI around zero) | Strong trends can hold above 70 or below 30; widening to 80 / 20 gives fewer, more extreme signals. |
| Heikin Ashi smoothing | Leave at the indicator default first | Raise it for fewer signals on fast markets like gold; lower it for quicker turns. |
| Timeframe | H1 or H4 for gold | Lower timeframes produce many more crosses around news releases. |
| Alerts | On for both signals | Lets you step away from the screen and review the chart when a cross happens. |
Change one setting at a time and compare. The built-in tester and performance panel make this quicker, but treat past results as a way to understand the indicator’s behaviour, not as a promise of future results.
05Step by step: setting up HARSI on gold this week
Gold makes a good practice market right now. Spot gold rose about 1.4% on Monday to roughly $4,123 an ounce after a gain of about 5% the previous week, as lower oil prices eased inflation worries (Business Recorder). On Tuesday it held near $4,120, with traders still pricing a high chance of a December Fed rate hike (Kotak Neo). CME FedWatch put those odds at around 81%, and US CPI is due on Tuesday 10 November with PPI on Friday. A fast rally plus a big data release is exactly when a raw RSI flickers and a smoothed view helps.
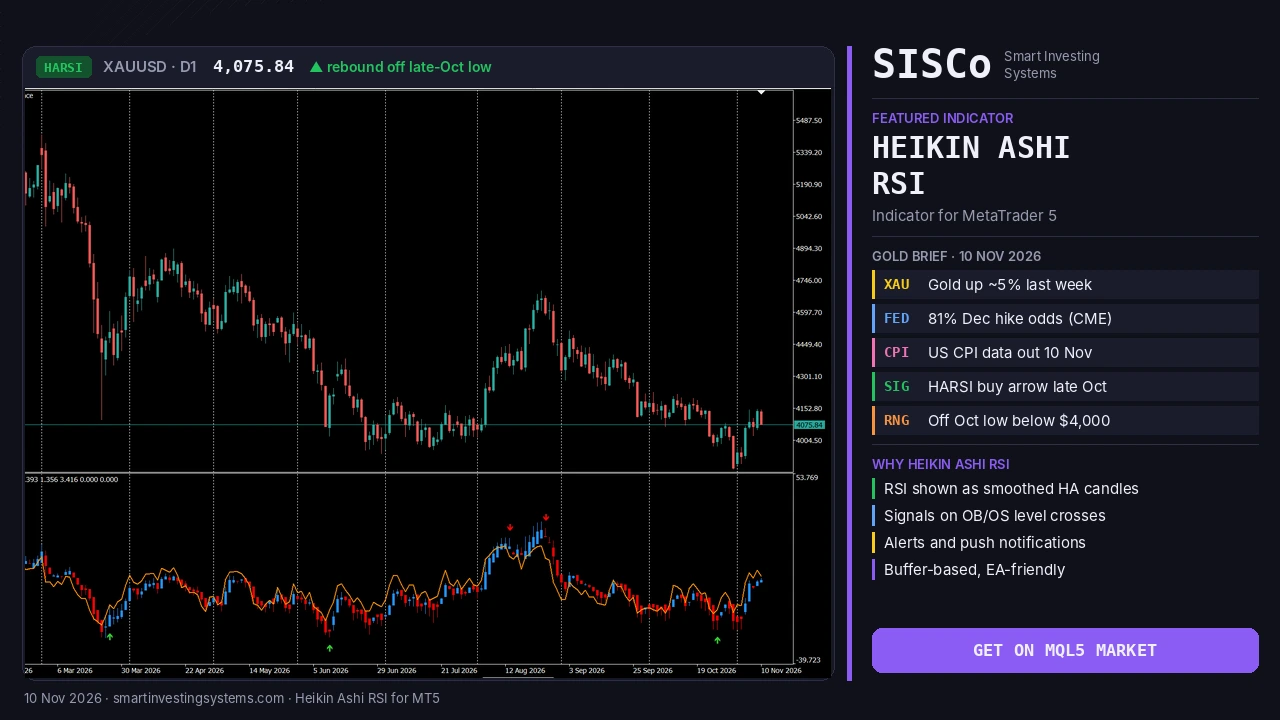
The chart at the top of this article shows how this looks in practice on XAUUSD daily. Gold slid through most of 2026, from above $5,300 in February toward the $4,000 area, and the HARSI candles spent much of that time red and hovering around or below the midline. Green buy arrows appeared near the March and June lows, two red sell arrows printed in August as price topped near $4,700, and a green buy arrow showed again in late October near the low. Since then the candles have turned blue and climbed while price rebounded to about $4,075 at the time of the screenshot. Note that the sub-window on this chart is scaled around zero (roughly −40 to +54), so set your overbought and oversold levels to match the scale your version shows.
Attach HARSI to XAUUSD H1
Open a gold chart, drag the indicator on and start with its default inputs. Confirm you see both the RSI candles and the RSI line in the sub-window.
Read the recent run
Scroll back over last week’s rally. Note how long HARSI candles stayed rising and whether RSI pushed into overbought territory, and how the candles behaved when the move paused.
Mark price levels on the main chart
Draw the recent swing high and the round $4,100 area. A HARSI signal near a level you already care about is more meaningful than one in the middle of nowhere.
Set alerts and step back around CPI
Turn on alerts for both signals. Around the data release, expect several quick crosses; let the candles settle for a few bars before reading anything into them.
Review with the tester
After the week, open the Strategy Tester and compare two smoothing values on the same period. Keep notes on which version gave clearer reads for your style.
06Combining HARSI with other tools, and mistakes to avoid
HARSI works best as one piece of a plan rather than the whole plan. It tells you about momentum; it does not tell you where the trend is or where to put a stop. Pairing it with a second, different kind of tool usually gives a cleaner picture.
Trend filter
Only take HARSI buy signals when price is above a rising moving average, and sell signals when below a falling one.
Second RSI view
Compare with the Laguerre RSI, which smooths RSI with a four-stage filter, to see if both agree on a turn.
Momentum shift
Smart Multi RSI compares a fast and a slow RSI, which helps confirm that momentum is really changing.
Price levels
Support, resistance and round numbers give context; a signal at a level is worth more than one in open space.
In a strong trend RSI can stay overbought or oversold for a long time. Fading every extreme against a powerful move is the most common way to misuse any RSI tool.
Smoothing always adds some delay. HARSI candles will turn a little after the raw RSI line, which is the price you pay for fewer false reads.
07Turning HARSI signals into an Expert Advisor
A detail that matters if you automate: according to the product description, HARSI handles all calculations through indicator buffers only, with no graphical objects for signals or candles. That makes it fast and EA-friendly, because an Expert Advisor can read the signal values directly from the buffers instead of trying to detect arrows drawn on the chart.
A typical rule set might be: read the buy and sell buffers on the last closed bar, check a trend filter, then manage entries, stop-loss, take-profit and position size in the EA. The indicator supplies the signal; the EA supplies the discipline. If you want this built for you, our custom EA service turns a written strategy into a working MT5 robot, and the algorithmic trading page explains what we build and how projects run.
- Use the last closed bar for signals so values do not change while a candle is still forming.
- Write exit rules as carefully as entry rules: stops, targets and time-based exits.
- Test the EA in the Strategy Tester on several periods, including news-heavy weeks.
Frequently asked questions
What is the Heikin Ashi RSI indicator?
It is an MT5 indicator that applies Heikin Ashi smoothing to RSI values and shows them as candles in a separate window, together with the standard RSI line, so momentum is easier to read.
When does HARSI give a buy or sell signal?
A buy signal when RSI crosses above the oversold level, and a sell signal when RSI crosses below the overbought level. You choose both levels in the settings.
Can an Expert Advisor use HARSI signals?
Yes. The indicator works through buffers only, so an EA can read its signal data directly. We can build that EA for you through our custom EA service.
Can I try it before buying?
Yes. A free demo is available on the MQL5 Market, and you can run it in the MetaTrader 5 Strategy Tester before deciding.
Try the Heikin Ashi RSI on your own charts
See momentum as clean candles instead of a jagged line, set alerts for overbought and oversold crosses, and test settings with the built-in tester. Download the free demo and run it on gold or any symbol you trade.
Trading involves risk. This article is educational, describes software tools only and is not financial advice.
Gold · Heikin Ashi RSI · indicators · mt5 · RSI
Related articles
Trend Strength Index MT5: Is Gold’s Rebound Steady Before CPI?
Learn how the Trend Strength Index for MT5 shows how steady gold's rebound is before US CPI, with settings, signals and a step-by-step plan.…
Read more →
Convert MT4 EA to MT5: What OANDA’s MT4 Shutdown Means
Convert MT4 EA to MT5 before brokers like OANDA Japan switch off MT4. Learn what changes in MQL5, how to test it, and get…
Read more →
Moving Average Ribbon MT5: How to Read the Madrid Ribbon
Learn how a moving average ribbon on MT5 shows trend, pullbacks and reversal warnings, with Madrid Ribbon color rules and a gold example. Try…
Read more →Need a team that can design, build and maintain it all?
Let's talk. Tell us about your project and we'll reply with honest timelines.