Moving Average Ribbon MT5: How to Read the Madrid Ribbon
A single moving average tells you one thing: is price above or below it? A moving average ribbon on MT5 tells you far more. When a stack of averages fans out in the same direction, the trend is healthy. When the averages squeeze together or start to cross, the trend is tiring, pulling back or turning. This guide explains how a ribbon works, how to read the four colors of the Madrid Ribbon indicator for MT5, and how to build a simple, rules-based routine around it, using this week’s swing in gold as a live example.
01What a Moving Average Ribbon Actually Shows
A moving average ribbon is simply several moving averages of different lengths plotted together. Short averages react quickly to price; long averages react slowly. Because each line sits at a different “speed”, the gaps between them tell you how strongly the market agrees on a direction.
- Fanned out and ordered: fast averages above slow ones (or below, in a downtrend), with wide, even gaps. This is a trend with momentum behind it.
- Compressing: the lines move closer together. Momentum is fading, often during a pullback or a range.
- Twisting: the fast lines cross through the slow ones. The old trend has lost control and a reversal may be developing.
That is the key advantage over a classic two-line crossover. A crossover gives you one binary event. A ribbon shows you the whole process, from a strong trend, to a pause, to a possible turn, so you can see a change coming before the final cross happens.
02How the Madrid Ribbon Colors Work
The Madrid Ribbon layers several exponential or simple moving averages into one ribbon and colors it according to the prevailing momentum. According to its product description, the four colors mean:
Lime: uptrend
The averages agree on an upward direction. This is the “trend is your friend” phase for buyers.
Green: pullback
A pullback or possible reversal warning inside an uptrend. Often where trend traders look to re-enter.
Red: downtrend
The averages agree on a downward direction. Sellers are in control.
Maroon: peak or warning
A peak or possible reversal warning. Momentum is shifting and the ribbon may be about to flip.
You can choose between exponential and simple moving averages. EMAs weight recent prices more heavily, so the ribbon reacts faster; SMAs are smoother and slower. The product page also notes that the ribbon is designed for an uncluttered look and displays best on a dark chart background.
03A Current Example: Gold’s Swing Around $4,000
Gold has given ribbon traders a textbook test this week. After sliding to a one-year low at the end of October, the metal climbed back above $4,000 and traded near $4,122 on Thursday, according to Fortune’s daily gold price tracker. On Friday, 6 November, the US economy added 165,000 jobs in October against roughly 65,000 expected, and unemployment fell to 4.1%. The dollar rose and gold slipped about 1% to around $4,045 an ounce, as reported by The Rio Times and FinanceFeeds. Before the report, CME FedWatch already showed a better than 70% chance of a Fed rate hike in December, per Yahoo Finance.
This is exactly the kind of market where a ribbon earns its place. A rebound after a big low raises an awkward question: is this a new uptrend, or just a bounce inside a larger decline? On an H4 or daily chart, a ribbon helps you frame it without guessing:
- If the ribbon has turned lime during the rebound and Friday’s dip only turns it green, that reads as a pullback within a young uptrend.
- If the dip turns the ribbon maroon and then red, the rebound has failed and the bigger downtrend is back in charge.
- If the lines are tangled and flipping color every few bars, the market is ranging and trend signals deserve less trust.
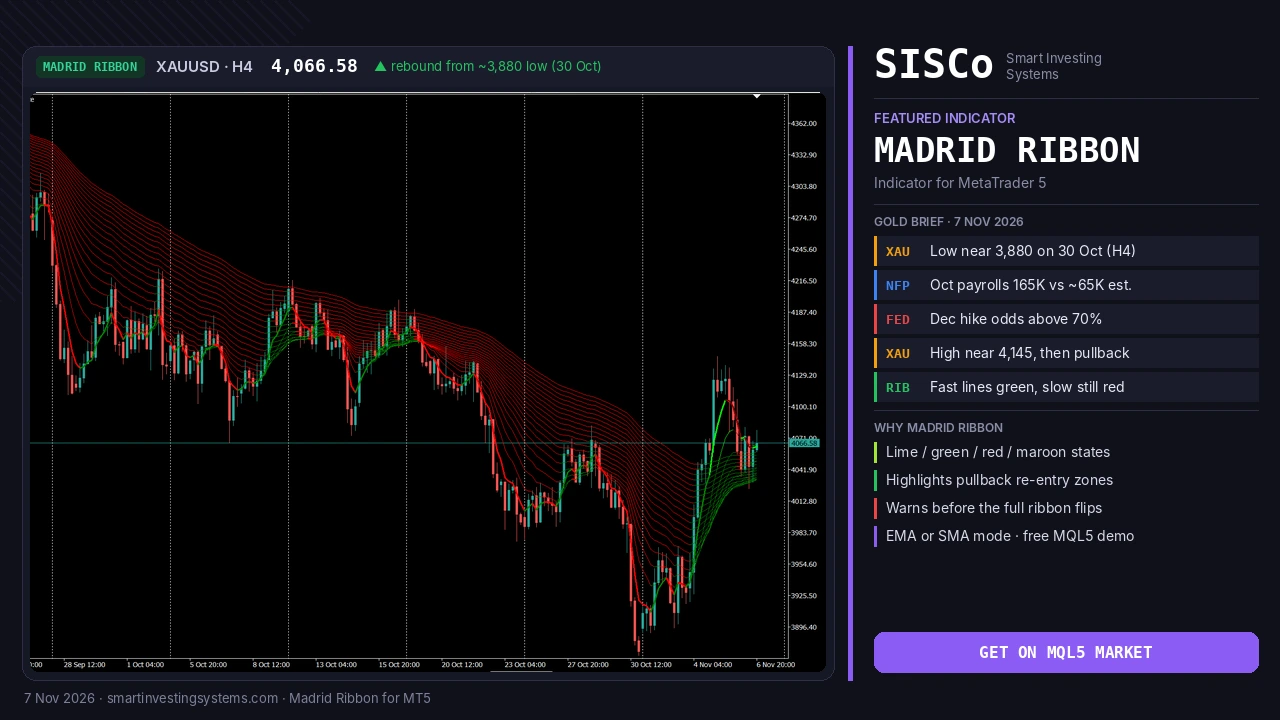
On the XAUUSD H4 chart below, the ribbon stays mostly red through the slide from late September to the 30 October low near 3,880. During the rebound, the fastest lines turn green and fan upward while the slower lines stay red, and price stalls around 4,066 after peaking near 4,145. That mix shows a young bounce that has not yet flipped the longer-term picture.
The point is not to predict where gold goes after next week’s inflation data. It is to let the ribbon tell you which of these three states you are in, and to act only on the setups your plan allows in that state.
04Step by Step: Setting Up the Ribbon in MT5
Install and test the demo
Download the free demo from the MQL5 Market and run it in the MetaTrader 5 Strategy Tester on the symbol you trade, for example XAUUSD.
Pick EMA or SMA
Start with exponential averages if you trade intraday and want faster color changes. Try simple averages if you swing trade and prefer fewer, smoother shifts.
Use a dark background
Switch to a dark chart template so the lime, green, red and maroon phases stand out clearly from the candles.
Choose a trend timeframe
Decide which timeframe defines “the trend” for you, for example H4 or D1, and read the ribbon color there before looking at lower timeframes.
Write your rules down
Note what you will do in each color phase (see the table below) before you place a single trade, then review the rules against past charts.
05A Simple Ribbon Routine: What to Do in Each Phase
The table below turns the four colors into a starting framework. The timeframe pairings and actions are suggested starting points to test, not fixed rules, and they should be checked in the Strategy Tester on your own market.
| Ribbon color | Market state | Starting-point action to test | What to avoid |
|---|---|---|---|
| Lime | Uptrend | Favor buys only; hold existing longs | Fighting the trend with counter-trend sells |
| Green | Pullback in uptrend | Watch for a re-entry long when price stabilizes | Chasing the high just before the pullback |
| Maroon | Peak / reversal warning | Tighten stops, take partial profits | Adding new longs into the warning |
| Red | Downtrend | Favor sells only; hold existing shorts | Buying “cheap” against the trend |
| Mixed / flipping | Range or chop | Stand aside or reduce size | Treating every color change as a signal |
A practical timeframe pairing to start testing: read the ribbon on D1 for swing trades and time entries on H4, or read it on H4 for day trades and time entries on M30–H1. Only take lower-timeframe signals that agree with the higher-timeframe color.
📈 Bullish signal
- Higher-timeframe ribbon is lime
- Lower timeframe shows a green pullback phase
- Ribbon returns to lime as price resumes higher
- Stop beyond the pullback low
📉 Bearish signal
- Higher-timeframe ribbon is red
- Lower timeframe shows a maroon warning after a bounce
- Ribbon turns red again as price rolls over
- Stop beyond the bounce high
06Common Ribbon Mistakes (and How to Avoid Them)
Trading every color change. In a range, the ribbon will flip often. Use the higher-timeframe color as a filter and skip trades against it.
Ignoring news risk. Data like Friday’s jobs report can move gold sharply within minutes. A ribbon is built from past prices and reacts after the move, not before it.
Treating warnings as reversals. Green and maroon are warnings, not confirmations. Wait for your rules to confirm before reversing a position.
Using the ribbon alone. Combine it with support and resistance levels, position sizing and a fixed stop. No single indicator is a complete trading plan.
07Ribbon vs Single Moving Average vs Slope Tools
A ribbon is not the only way to read moving-average trends on MT5. If you prefer one clean line, CM Ultimate MA is a configurable moving average that changes color with trend direction, offers several MA types including Tilson T3, and marks crossovers with dots. If you care most about how steeply a trend is rising or falling, the Slope MA indicator measures the slope of an EMA, normalizes it by ATR so it is comparable across markets, and plots arrows when slope conditions change.
Madrid Ribbon
Best when you want to see trend, pullback and warning phases at a glance across many averages.
CM Ultimate MA
Best when you want one or two configurable averages and clear crossover dots.
Slope MA
Best when trend strength (the angle of the average) matters more than its position.
Have a ribbon rule set you trust and want it traded automatically? An Expert Advisor can read the ribbon state, apply your filters and manage stops. See how we approach it on our custom EA development page.
08FAQ
What is a moving average ribbon in MT5?
It is a group of moving averages with different lengths plotted together on a MetaTrader 5 chart. The spacing and order of the lines show how strong and how consistent the trend is.
What do the Madrid Ribbon colors mean?
Lime is an uptrend, green is a pullback or possible reversal warning, red is a downtrend, and maroon is a peak or possible reversal warning.
Should I use EMA or SMA for the ribbon?
The Madrid Ribbon lets you choose either. EMAs react faster and suit shorter-term trading; SMAs are smoother and can suit swing trading. Test both on your market before deciding.
Can I try the Madrid Ribbon before buying?
Yes. You can download a free demo from the MQL5 Market and run it in the MetaTrader 5 Strategy Tester.
See the Trend, the Pullback and the Warning in One Glance
Add the Madrid Ribbon to your MT5 chart, test it on gold or your favorite pair in the Strategy Tester, and build a color-based routine you can follow with confidence.
Trading involves risk, and you can lose money. This article is for educational purposes only and is not financial advice.
Gold · Madrid Ribbon · Moving Average · mt5 · Trend
Related articles
Heikin Ashi RSI MT5: How to Read HARSI Candles (Gold Guide)
Learn how the Heikin Ashi RSI (HARSI) indicator for MT5 turns RSI into smooth candles, which settings to test, and how to read it…
Read more →
Trend Strength Index MT5: Is Gold’s Rebound Steady Before CPI?
Learn how the Trend Strength Index for MT5 shows how steady gold's rebound is before US CPI, with settings, signals and a step-by-step plan.…
Read more →
Convert MT4 EA to MT5: What OANDA’s MT4 Shutdown Means
Convert MT4 EA to MT5 before brokers like OANDA Japan switch off MT4. Learn what changes in MQL5, how to test it, and get…
Read more →Need a team that can design, build and maintain it all?
Let's talk. Tell us about your project and we'll reply with honest timelines.