Trend Strength Index MT5: Is Gold’s Rebound Steady Before CPI?
Gold has climbed from a one-year low near $3,870 to the $4,100 area, and on Tuesday the October US CPI report lands right on top of that rebound. If you trade XAUUSD, the real question before the data is not “how far has gold moved?” but “how steady has the move been?” A rebound that grinds higher bar after bar behaves very differently around a big release from one that lurches up and down. The Trend Strength Index for MT5 answers exactly that question with one line on a fixed scale from -1 to +1. This guide explains what the indicator measures, how to read gold’s rebound with it this week, and how to plan around CPI without chasing a candle.
Every setting and rule below is a starting point to test on your own broker’s data. Nothing here is a forecast, a signal or a promise of results.
01What Is Moving Gold This Week
Spot gold opened the week higher, trading around $4,112 to $4,122 on Monday morning after a Friday decline, according to FinanceFeeds and Saxo’s Market Quick Take. That puts the metal well above its October 30 low near $3,870, but still below local resistance near $4,150 that both sources point to.
The backdrop is a tug-of-war between strong data and inflation relief:
- Jobs: October nonfarm payrolls rose by 165,000, far above forecasts of roughly 60,000 to 65,000, and unemployment slipped to 4.1% from 4.2%.
- The Fed: the target range sits at 3.75% to 4.00%, and futures have moved further toward a rate hike at the December 8–9 meeting after the jobs beat.
- Oil: Brent fell sharply last week and traded below $100 on Monday, which eases some inflation pressure.
- Data: October CPI is due Tuesday, November 10 at 8:30 a.m. ET, and PPI follows on Friday, November 13. September’s reading was 0.6% month on month for headline CPI and 0.3% for core, according to RoboForex’s week-ahead calendar.
A hot print would add to the case for a December hike, which has tended to weigh on gold. A soft print could do the opposite. Either way, the release can turn a smooth trend into a choppy one within minutes, which is why measuring the quality of the trend before the number is useful.
02What the Trend Strength Index Measures
Most oscillators ask how far price has moved. The Trend Strength Index indicator for MT5 asks how consistently it has moved. Over the last Length bars (default 14) it calculates the correlation between the closing price and the bar number, which is simply time.
Near +1
Price has been rising in a steady, almost straight line. Each bar closes a little higher than the one before.
Near 0
Price is swinging back and forth with no consistent relationship to time. Direction is unclear.
Near -1
Price has been falling steadily. Each bar closes a little lower than the last.
Because the value always stays between -1 and +1, the same reading means the same thing on gold, EUR/USD, an index or a crypto pair, and on any timeframe. That makes it easy to compare gold’s H1 rebound with its H4 structure without rescaling anything in your head.
03Trend Strength Index vs True Strength Index and ADX
Both the Trend Strength Index and the True Strength Index are often shortened to “TSI”, which causes confusion when traders search for a trend strength indicator. They are different tools:
| Indicator | What it measures | Scale | Gives direction? |
|---|---|---|---|
| Trend Strength Index | How consistently price has moved, using price-time correlation | Fixed, -1 to +1 | Yes: the sign shows direction |
| True Strength Index | Double-smoothed momentum | No fixed range | Yes, via zero line |
| ADX | How strong a trend is | 0 to 100 | No |
The practical difference for this week: ADX can tell you gold is trending, but not whether it is trending up. The Trend Strength Index gives direction and steadiness in a single line, so you can see whether the rebound from $3,870 is clean or ragged.
04How the Buy and Sell Signals Work
The signals are built around one input, the Trigger Level, which you set between -1 and 1. It applies symmetrically above and below zero.
📈 Bullish signal
- Trend strength first drops below the negative trigger, meaning a strong, steady decline.
- It then crosses back up through that level as the decline loses consistency.
- A buy arrow marks the moment the downtrend starts to break down.
📉 Bearish signal
- Trend strength first rises above the positive trigger, meaning a strong, steady rally.
- It then crosses back down through that level as the rally starts to stall.
- A sell arrow marks the moment the uptrend loses its consistency.
These are turning-point signals, not trend-following entries. On gold this week, a sell signal on H1 would not mean “gold will fall”. It would mean the steady climb of the last few sessions has become less orderly, which is often useful for tightening a stop or taking partial profit on a long you already hold before CPI.
05Reading Gold’s Rebound Step by Step Before CPI
Here is a simple routine for using the indicator on XAUUSD in the run-up to the release. It is a process for reading the chart, not a trading signal.
Start on H4 for context
Attach the Trend Strength Index with the default Length of 14. Check whether the line has moved from negative territory during the late-October slide toward the positive side during the rebound. That tells you which way the broader move has been leaning.
Drop to H1 for steadiness
On H1, note whether the value is holding near the top of the scale or drifting back toward zero. A reading slipping toward zero while price is still near its highs suggests the rebound is turning choppy under resistance.
Mark the levels that matter
Draw the $4,150 resistance area and the $4,000 round number. Pair the oscillator with the Support and Resistance Levels indicator if you prefer levels plotted for you.
Decide before the number
Write down what you will do if a sell signal appears near resistance, and what you will do if strength stays high into the release. Deciding in advance removes the urge to react to the first spike at 8:30 a.m. ET.
Let the dust settle after CPI
The first candles after a big release are often erratic. Wait for several bars to close so the correlation reflects the new move, then read the line again before acting.
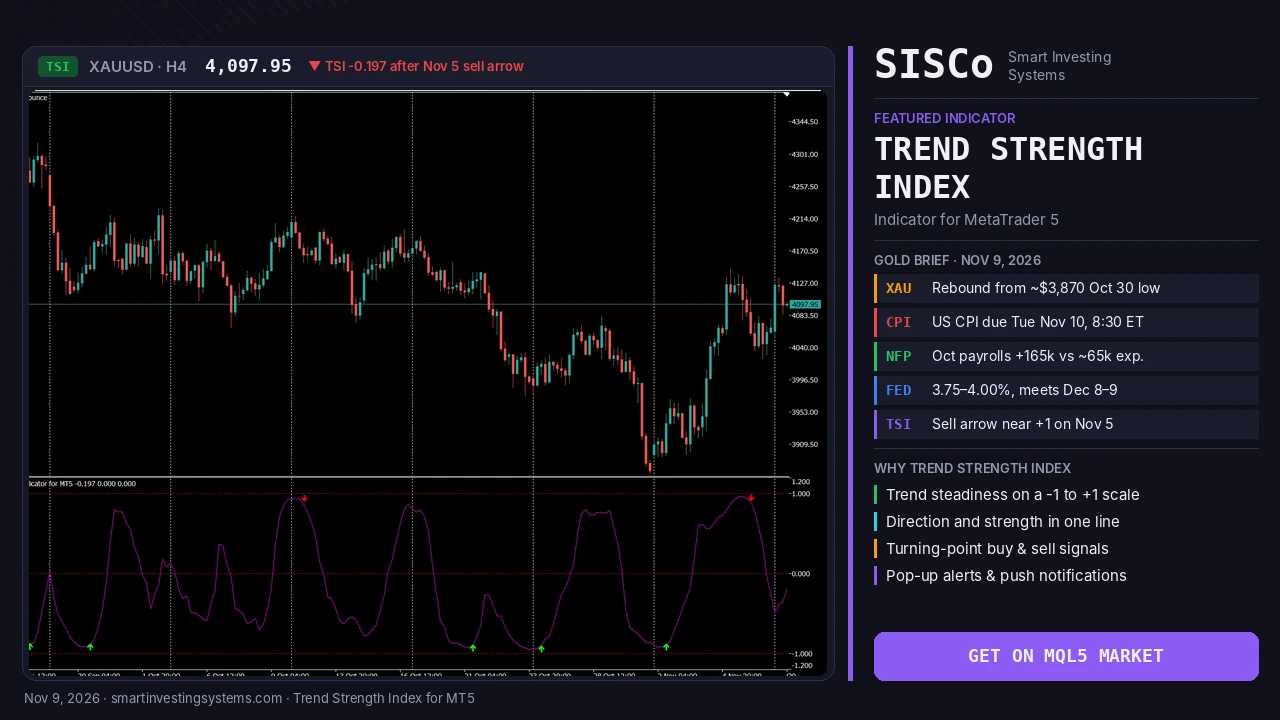
What the banner chart shows: on the XAUUSD H4 chart in the banner, the Trend Strength Index sank to near -1 during the slide into the late-October low and printed a buy arrow in early November as that decline lost consistency. The rebound then lifted the line to near +1, and a sell arrow appeared around November 5 as the climb stalled below $4,150. By Monday the line had fallen back below zero, at about -0.20, with price near $4,098. In other words, the rebound is still in place on price, but it has become far less orderly heading into CPI.
06Settings to Test on XAUUSD
The product page states one default, a Length of 14. The values below are starting points to test, not recommendations. Use the built-in backtest panel to compare combinations on your own broker’s gold feed.
| Use case | Timeframe | Length (starting point) | Trigger Level (starting point) |
|---|---|---|---|
| Intraday read around CPI | M15–H1 | 14 (default) | 0.7 |
| Swing view of the rebound | H4 | 20 | 0.8 |
| Fewer, more selective signals | H1–H4 | 14–20 | 0.9 |
| More frequent signals | M15–H1 | 10 | 0.5 |
Shorter lengths react faster and suit intraday charts; longer lengths smooth noise for swing trading. A Trigger Level further from zero means the indicator only signals after very clean trends, so you get fewer signals. A level closer to zero signals more often.
To test a combination, turn on Back Test Indicator, choose a Test Start Time, and enter a take-profit and stop-loss in points. The on-chart panel tracks buy and sell signals since that date against those levels. If a candle hits both levels, the panel counts the stop-loss first, so results lean conservative. Treat any result as history on one symbol, not a guide to the future.
07Combining It With Structure and Automation
Trend strength works best as a filter. A common pairing is the Market Structure CHoCH/BOS indicator: use it to spot a structural shift on gold, and use the Trend Strength Index to confirm that the prior trend was strong and is now fading. If both line up near a level such as $4,150, you have two independent reasons to pay attention rather than one.
Alerts on the go
Turn on pop-up alerts or push notifications so new signals reach the MetaTrader mobile app, useful when CPI week keeps you away from the screen.
Use it in your own EA
The indicator exposes buffers, so its values can feed a rule inside your own Expert Advisor, for example as a filter that blocks entries when trend strength is near zero.
If you want that logic built into a complete Expert Advisor with your own entry, exit and risk rules, our team can create a custom EA around it.
Spreads on gold can widen sharply around CPI. Factor that into any stop or take-profit you test, and check your broker’s conditions.
The indicator measures steadiness, not size. A slow, tidy move and a fast, tidy move can both read near +1.
08Frequently Asked Questions
Is the Trend Strength Index the same as the True Strength Index?
No. The True Strength Index is a double-smoothed momentum oscillator with no fixed range. The Trend Strength Index measures how consistently price has moved, using the correlation between price and time, on a fixed scale from -1 to +1.
Can I use it on gold before CPI?
Yes. It works on any symbol and timeframe, including XAUUSD. Before a release it helps you judge whether the current move is orderly or already turning choppy. It does not predict the CPI number or the market’s reaction.
Are the signals trend-following or reversal signals?
They are turning-point signals. A buy fires when strength climbs back through the negative trigger as a steady decline loses consistency; a sell fires when strength falls back through the positive trigger as a steady rally stalls.
Is there a free demo?
Yes. You can download the free demo from the MQL5 Market and run it in the MetaTrader 5 Strategy Tester before buying.
See How Steady Gold’s Rebound Really Is
Add the Trend Strength Index to your XAUUSD chart before Tuesday’s CPI release and read the quality of the move, not just its size. Test the settings in the Strategy Tester with the free demo, then set alerts so new signals reach your phone.
Trading involves risk, including the loss of your capital. This article is for education only and is not financial advice.
Gold · mt5 · Trend · Trend Strength Index · Volatility
Related articles
Heikin Ashi RSI MT5: How to Read HARSI Candles (Gold Guide)
Learn how the Heikin Ashi RSI (HARSI) indicator for MT5 turns RSI into smooth candles, which settings to test, and how to read it…
Read more →
Convert MT4 EA to MT5: What OANDA’s MT4 Shutdown Means
Convert MT4 EA to MT5 before brokers like OANDA Japan switch off MT4. Learn what changes in MQL5, how to test it, and get…
Read more →
Moving Average Ribbon MT5: How to Read the Madrid Ribbon
Learn how a moving average ribbon on MT5 shows trend, pullbacks and reversal warnings, with Madrid Ribbon color rules and a gold example. Try…
Read more →Need a team that can design, build and maintain it all?
Let's talk. Tell us about your project and we'll reply with honest timelines.