
Trend Strength Index Indicator for MT5
The Trend Strength Index for MT5 measures the momentum, strength and direction of market trends with precision. Settings explained, with video demo.
- MetaTrader 5
- Works on VPS
- Lifetime support
About Trend Strength Index Indicator for MT5
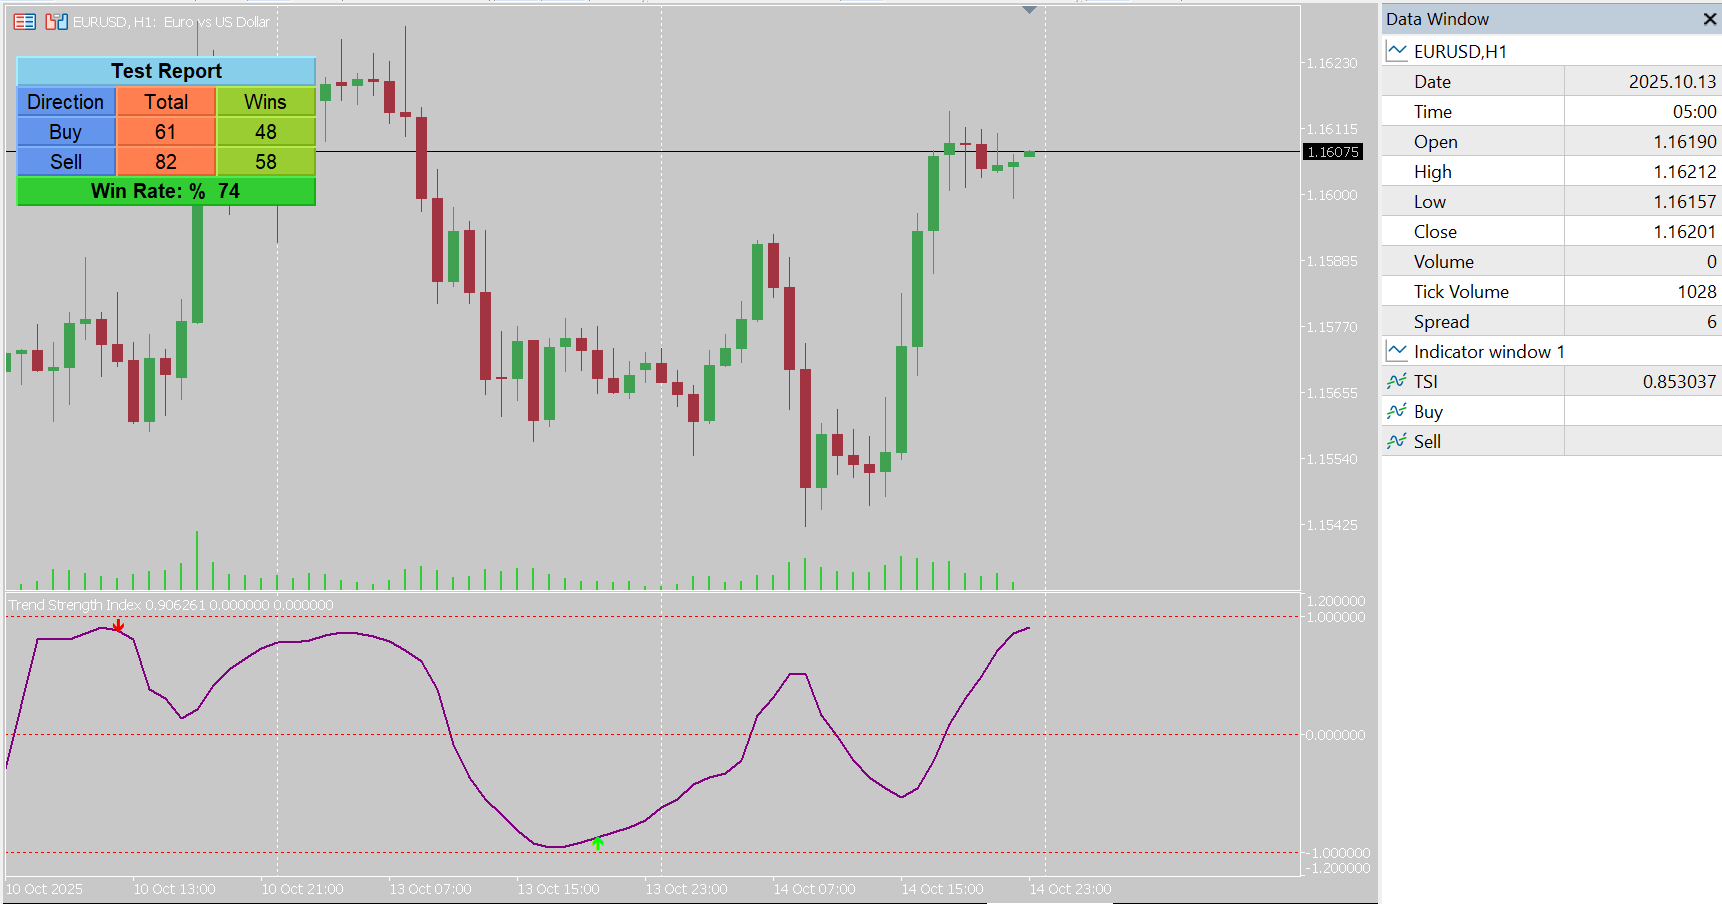
In short: the Trend Strength Index for MetaTrader 5 scores how cleanly price has trended over recent bars, from -1 (a steady fall) to +1 (a steady rise), and signals when a strong trend starts to lose its consistency. It comes with alerts, push notifications and a built-in backtest panel.
What the Trend Strength Index measures
Most oscillators ask how far price has moved. The Trend Strength Index asks how consistently it has moved. Over the last Length bars it calculates the correlation between the closing price and the bar number, which is simply time.
- If every bar closes a little higher than the last, price and time move together perfectly and the value is close to +1.
- If every bar closes a little lower, the value is close to -1.
- If price swings back and forth, there is no consistent relationship with time and the value stays near 0.
Because the result is always between -1 and +1, the same reading means the same thing on EUR/USD, gold, an index or a crypto pair, on any timeframe.
Trend Strength Index vs True Strength Index (and ADX)
Both indicators are often called “TSI”, which causes confusion. The True Strength Index is a double-smoothed momentum oscillator; its values depend on the size of price changes and it has no fixed range. The Trend Strength Index is a correlation measure with a fixed -1 to +1 scale that focuses on the steadiness of the move rather than its size.
It also differs from ADX. ADX tells you a trend is strong but not which way it is going. Here the sign gives the direction and the distance from zero gives the strength, in a single line.
How the buy and sell signals work
Signals are based on the Trigger Level, which you set between -1 and 1 and which applies symmetrically above and below zero:
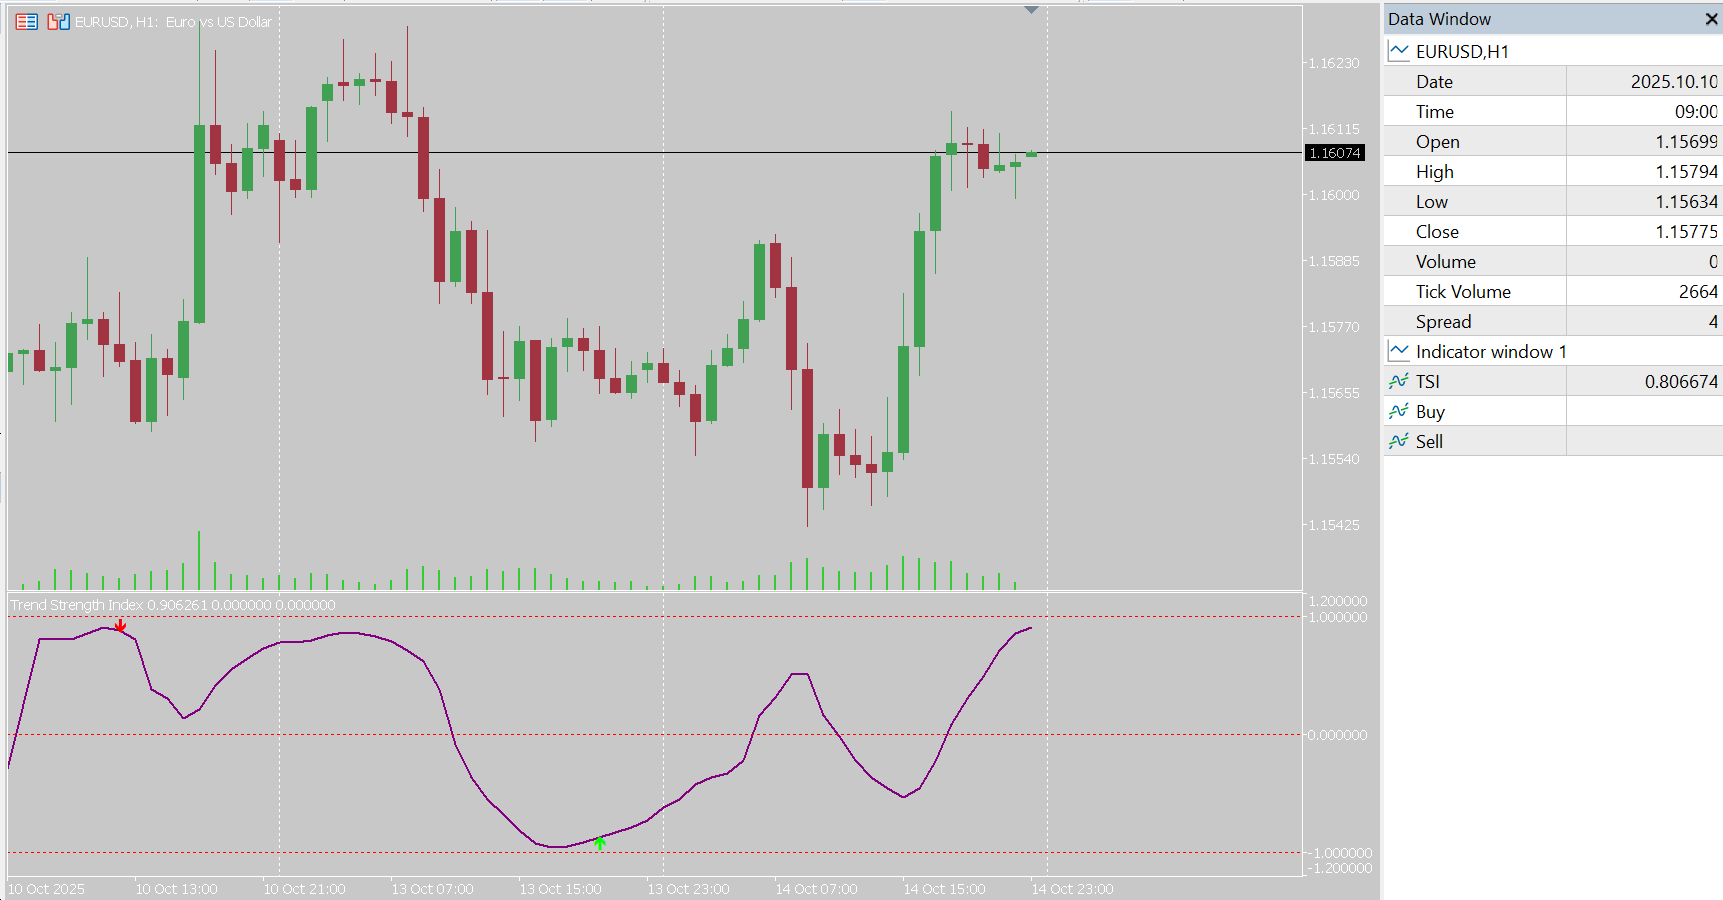
- Buy: trend strength first drops below the negative trigger (a strong, steady decline), then crosses back up through it as the decline loses consistency.
- Sell: trend strength first rises above the positive trigger (a strong, steady rally), then crosses back down through it as the rally starts to stall.
In other words, the indicator waits for a well-defined trend and then flags the moment that trend begins to break down. That makes the signals most useful for catching turning points after extended moves, and for timing exits from trend trades.
Choosing Length and Trigger Level
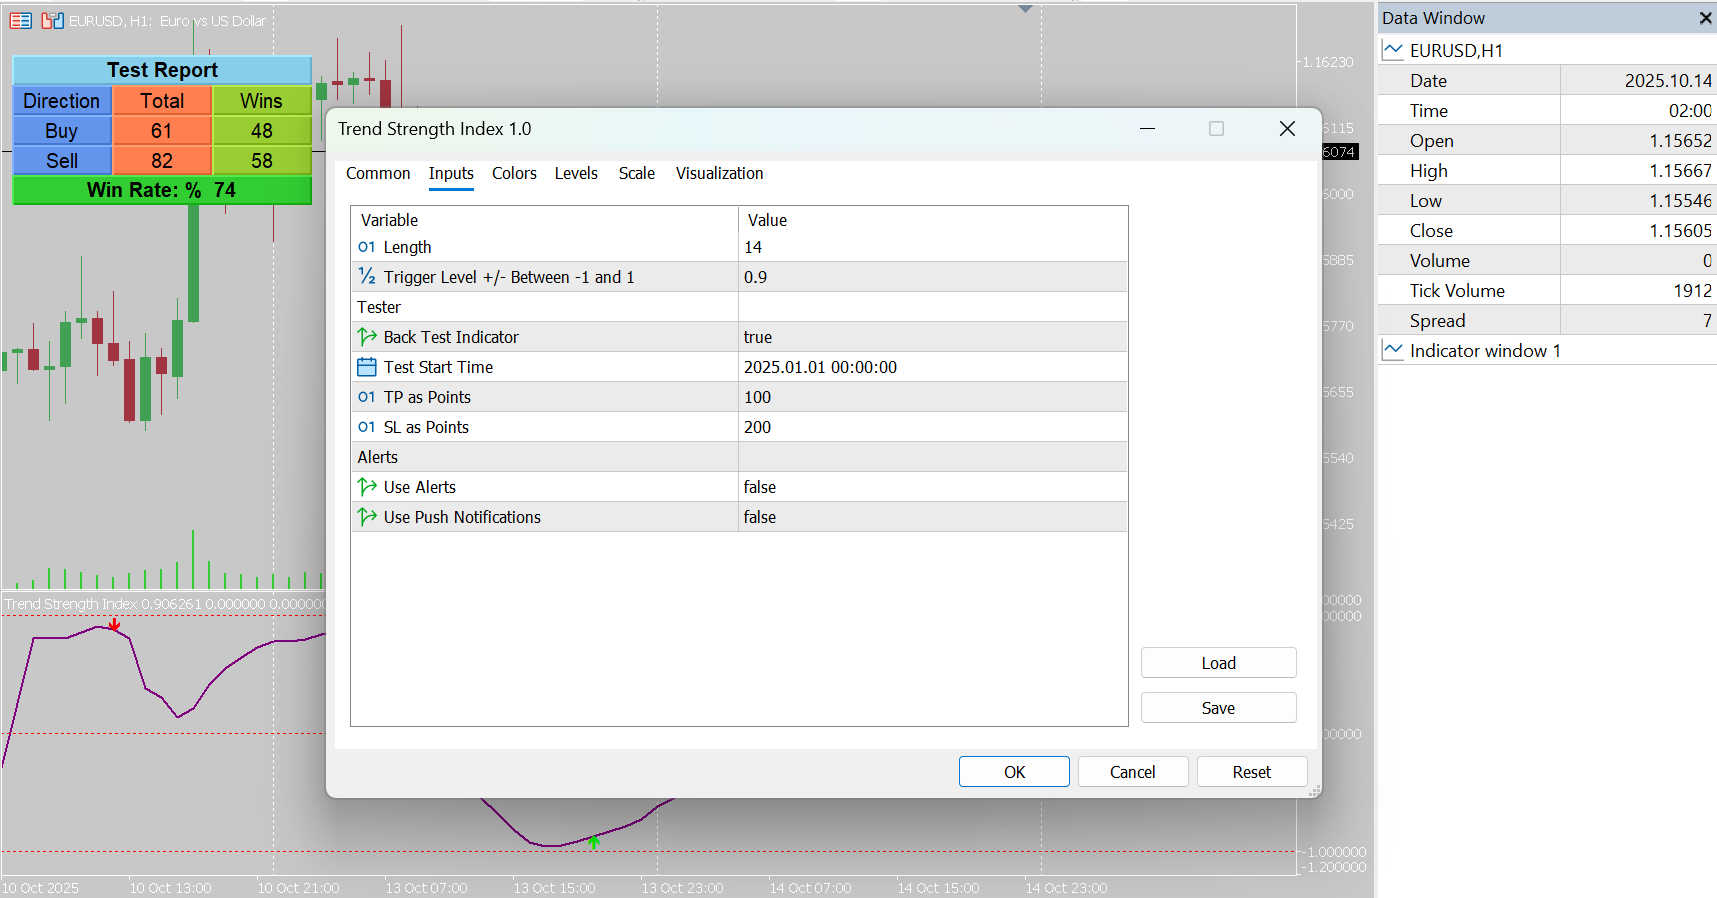
- Length (default 14) is the number of bars in the calculation. Shorter lengths react quickly and suit scalping and intraday charts; longer lengths smooth out noise for swing trading.
- Trigger Level controls selectivity. A level further from zero means the indicator only signals after very clean trends, so you get fewer but more selective signals; a level closer to zero gives more frequent signals.
- Compare combinations on your own symbols with the backtest panel rather than relying on one setting for every market.
Testing settings with the built-in panel
Turn on Back Test Indicator, choose a Test Start Time, and enter a take-profit and stop-loss in points. The on-chart panel then tracks the buy and sell signals since that date against your take-profit and stop-loss, and shows the trade counts and win ratios for buy and sell signals separately. If a candle reaches both your stop-loss and your take-profit, the panel counts the stop-loss as hit first, so the results lean conservative. It is a quick way to see how a given Length and Trigger Level behaved on a symbol before you trade it.
Combining it with other tools
Trend strength works well as a filter alongside structure. For example, use the Market Structure CHoCH/BOS indicator to spot a structural shift, and the Trend Strength Index to confirm the prior trend was strong and is now fading. The indicator also exposes buffers, so you can use its values inside your own Expert Advisor.
Frequently asked questions
Is this the same as the True Strength Index?
No. Both are often shortened to TSI, but the True Strength Index is a double-smoothed momentum oscillator. The Trend Strength Index measures how consistently price has moved in one direction, using the correlation between price and time, on a fixed scale from -1 to +1.
What do the values mean?
Close to +1 means price has been rising in a steady, almost straight line; close to -1 means a steady decline; values near 0 mean price is moving without a consistent direction.
Are the signals trend-following or reversal signals?
They are turning-point signals. A buy fires when strength climbs back up through the negative trigger level, meaning a steady downtrend is losing its consistency; a sell fires when strength falls back down through the positive trigger level.
What is the Trigger Level?
The threshold, between -1 and 1, that trend strength must cross back through to produce a signal. Levels further from zero give fewer signals that only follow very strong trends.
How is it different from ADX?
ADX tells you how strong a trend is but not its direction. The Trend Strength Index gives both: the sign shows direction and the distance from zero shows how consistent the trend is.
Does it send alerts to my phone?
Yes. Turn on push notifications and signals are sent to the MetaTrader mobile app. On-chart pop-up alerts are also available.
Is there a free demo?
Yes. Download the free demo from the MQL5 Market and run it in the MetaTrader 5 Strategy Tester before buying.
Inputs at a glance
- Length – bars used in the correlation calculation (default 14).
- Trigger Level – signal threshold between -1 and 1.
- Back Test Indicator – shows or hides the on-chart backtest panel.
- Test Start Time – start date for the backtest panel.
- TP as Points / SL as Points – take-profit and stop-loss used by the panel.
- Use Alerts – pop-up alerts on new signals.
- Use Push Notifications – signals sent to the MetaTrader mobile app.
The Trend Strength Index is an analysis tool and does not guarantee trading results.
Ready to try Trend Strength Index Indicator for MT5?
Download it from the MQL5 Market and attach it to your MetaTrader 5 chart in minutes.
Want it customized or need something similar? Request a free quoteTrading involves risk. Our indicators are analysis tools for educational and informational purposes and do not constitute financial advice. Read our Disclaimer.
More indicators

Volume Flow Indicator for MT5
The Volume Flow Indicator for MetaTrader 5 tracks money flow from price and volume on all timeframes to confirm trends and spot divergences.
View details →
Smart Multi RSI Indicator for MT5
Smart Multi RSI for MT5 uses a fast and a slow RSI together for a deeper view of momentum, crossovers and trend strength than…
View details →
Trendlines with Breaks Indicator for MT5
Automatically plot pivot-based trendlines in MetaTrader 5 that adapt their slope, and get highlighted signals when price breaks through them.
View details →