Follow Line Indicator MT5: Gold’s $4,100 Rebound Before NFP
Gold has swung from a one-year low near $3,870 to about $4,100 in a single week, and the October jobs report lands on top of that move. If you trade XAUUSD, the problem is simple: the rebound is fast, the next catalyst is big, and a fixed stop or a slow moving average will struggle with both. The Follow Line indicator for MT5 gives you one volatility-based trend line that shows which side of the market you are on and where that view stops being valid. This guide explains what the indicator shows, how to read gold’s rebound with it, and how to plan around payrolls without chasing a candle.
Every setting and rule below is a starting point to test on your own broker’s data. Nothing here is a forecast or a promise of results.
01What Moved Gold This Week
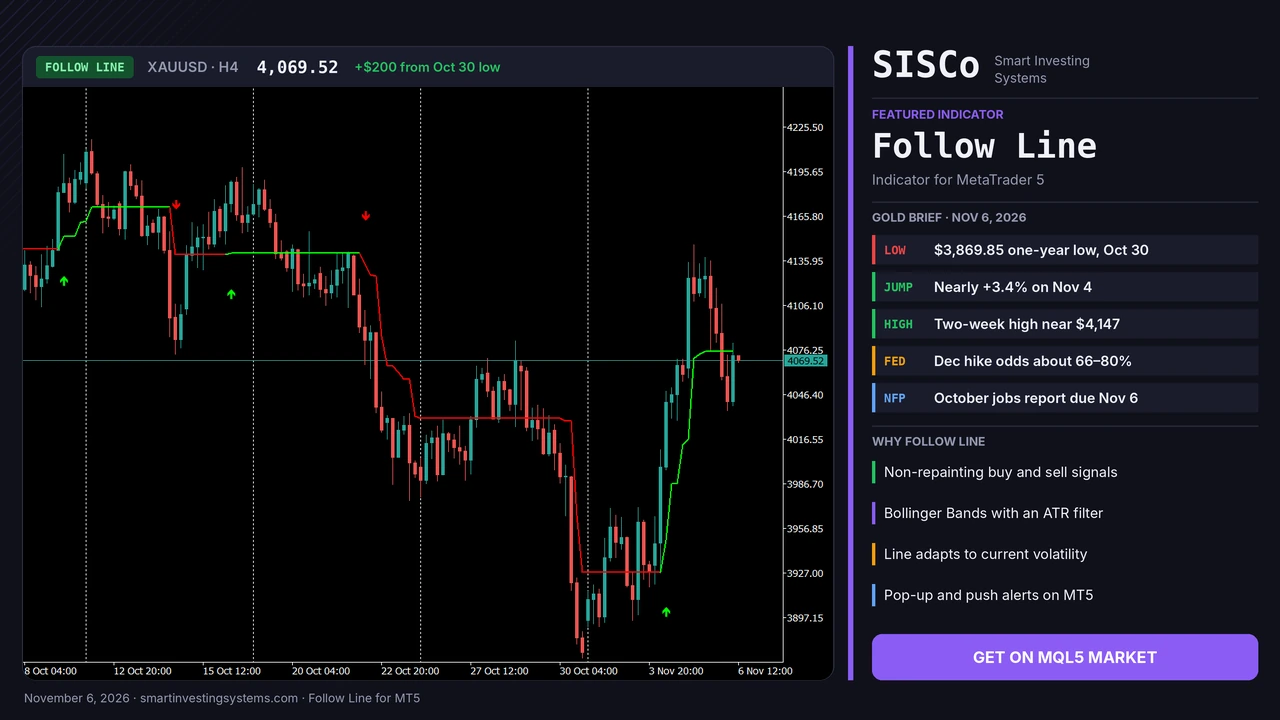
The levels matter because they frame every decision that follows. Spot gold hit a one-year low of $3,869.85 on October 30, then jumped nearly 3.4% on November 4, its biggest daily gain since August 19, and reached a two-week high near $4,147 on November 5, according to The Nation’s market report. That is a swing of roughly $275 from low to high.
By Friday morning the metal had eased back toward $4,050 to $4,100 and was still on course for a weekly gain of more than 4%, per Trading Economics. The main drivers were a softer dollar, lower Treasury yields and oil falling back under $100 a barrel after the US midterm results, which eased some inflation concern.
The low
$3,869.85 on October 30, the lowest level in a year.
The jump
Nearly 3.4% on November 4, the largest daily rise since August 19.
The high
Near $4,147 on November 5, the best level in about two weeks.
The catch
Markets still lean toward a December Fed hike, with reported odds from about 66% to 80% this week.
That last card is why the rebound is not a clean story. Gold rose even though traders still expect tighter policy. The October jobs report is due at 8:30 a.m. Eastern on November 6, with forecasts of around 60,000 new jobs after September’s 29,000 and unemployment seen at 4.2%. A surprise in either direction could test the whole move.
02What the Follow Line Indicator Shows
The Follow Line indicator for MT5 is a non-repainting trend-following line built from Bollinger Bands and an optional ATR filter. It follows price at a distance set by volatility, so it widens in active markets and tightens in quiet ones. The reading is deliberately simple:
- Green line below the candles: the trend is bullish, and a buy arrow marks the flip upward.
- Red line above the candles: the trend is bearish, and a sell arrow marks the flip downward.
- The line itself: a dynamic stop reference that already reflects current volatility.
Because signals are calculated in real time and do not repaint, what you see in chart history is what you would have seen live. That matters when you scroll back through a move like this one to judge how the indicator behaved.
03Why a Volatility-Based Line Suits a Payrolls Week
A week like this one changes the size of a normal candle. A stop that felt wide in a quiet September session can sit inside ordinary noise today. A line anchored to volatility adjusts with those conditions instead of asking you to guess a new distance by hand.
This is the main difference from a plain moving average, which follows price by averaging it and takes no account of how wild the session is. Follow Line is closer in spirit to other trend lines on the site. You can compare it with the Trend Magic indicator and the HalfTrend indicator to see which line suits your timeframe and your patience.
The limit is just as important. A volatility line reacts to the release after it happens. It does not know what the payrolls number will be, and it cannot protect you from a gap or a fast spike through your stop.
04How to Read Gold’s Rebound Step by Step
Use this routine on XAUUSD, and then on any other symbol you trade. Start from the higher timeframe so that a single news candle does not set your whole view.
Attach it to H4 first
Find the most recent flip on XAUUSD H4 and note its date relative to the October 30 low. This tells you whether the indicator treats the rebound as a trend or a pullback.
Mark the key levels
Draw the $3,870 low, the $4,000 round number and the $4,147 high. Then note where the Follow Line sits against them right now.
Drop to H1 for timing
Check whether H1 agrees with H4. If H4 is green and H1 is red, you are looking at a pullback inside a possible uptrend, so wait rather than force a trade.
Size the trade from the line
Measure the distance from your planned entry to the line, then set position size so that distance fits your risk limit. If the line is far away, trade smaller or skip it.
Let the news candle close
Around the release, judge the first closed candles rather than the spike. A flip that holds after the volatility settles tells you more than the first tick.
The banner chart shows how this looks on XAUUSD H4. The Follow Line stayed red above the candles through the slide into the October 30 low, then a buy arrow appeared around November 4 and the line turned green below the candles as price climbed through $4,000. After the high near $4,147, price pulled back and now sits just below the flattening green line near $4,070, with no new sell arrow on the chart. Earlier in October, the line flipped several times while gold moved sideways, which is the behaviour to watch for in a range.
05Bullish and Bearish Readings to Watch
Trade in the direction of the line colour, and use flips as entry or exit triggers. For gold this week, the two cases look like this:
📈 Bullish signal
- Line is green and below the candles on H4 and H1.
- Price holds above $4,000 after the jobs data.
- A buy arrow appears after a pullback and the candle closes on the right side of the line.
- Stop reference sits behind the line, not at a round number.
📉 Bearish signal
- Line flips red and moves above the candles on H1, then on H4.
- Price fails below the $4,147 high and loses $4,000.
- A sell arrow appears and strong data lifts Fed hike odds again.
- Stop reference sits above the line.
Be selective if neither case is clear. Trend-following lines flip more often in sideways markets, and a range between roughly $4,000 and $4,150 after payrolls would be exactly that kind of market.
06Follow Line Settings to Test on Gold
The indicator has four main inputs. The table shows how each one behaves and which direction to test first. Start from the defaults, change one input at a time, and treat all of this as a starting point rather than a recommendation.
| Input | Higher value | Lower value | Starting point to test on gold |
|---|---|---|---|
| BB Period | Smoother, more stable trend | Faster reaction to short-term changes | Keep the default on H4, test lower on M15 |
| BB Deviations | Fewer false signals, fewer entries | More frequent entries | Test higher during news-heavy weeks |
| Use ATR Filter | On smooths volatility and avoids sudden flips. Off reacts directly to Bollinger signals. | Leave on around payrolls and CPI | |
| ATR Period | More stable line for longer trends | More reactive filter | Test higher for swing trades |
To compare settings quickly, turn on Use Tester, pick a Test Start Time and set TP Points and SL Points. The panel then reports total trades, wins and win rate on the chart for your own symbol and broker data. You can also switch on Use Alerts for pop-ups and Use Push Notifications to get flips on the MT5 mobile app, which is useful when you do not want to watch every candle before a release.
07Mistakes to Avoid Around the Jobs Report
Chasing the first spike. The first move after a data release can reverse. Wait for candles to close before you judge a flip.
Ignoring spreads. Spreads and slippage can widen around big releases, so a stop near the line may fill worse than planned.
Treating every flip as a trade. In a range, a trend line can flip back and forth. Use the higher timeframe as your filter.
Forgetting the next catalyst. October inflation data and the December Fed meeting are still ahead, so one good session does not settle the trend.
If you want these rules to run the same way every time, the indicator’s signals can become the basis of an automated system. Our team can build a custom Expert Advisor around your own entry, stop and news-filter rules.
08Follow Line Indicator FAQ
Does the Follow Line indicator repaint?
No. The product is a non-repainting indicator, and its signals are calculated in real time.
What timeframe should I use for gold?
There is no single right answer. This guide uses H4 for direction and H1 for timing, while scalpers usually lean toward lower periods and faster charts. Test what works on your own symbol and broker data.
Can Follow Line predict the payrolls reaction?
No. It reacts to price and volatility after they happen. It helps you define trend direction and a stop reference, and it does not forecast data or guarantee an outcome.
Can I try it before buying?
Yes. You can download a free demo from the MQL5 Market listing and run it in the MetaTrader 5 Strategy Tester before buying.
Follow the Trend, Not the Headline
Follow Line gives you one clear line for trend direction and a stop reference that adapts to volatility, on whichever symbols you test. Try the free demo and test your own rules before the next big release.
Trading involves risk and you can lose money. This article is for education only and is not financial advice.
Follow Line · Gold · mt5 · Trend · Volatility
Related articles
Heikin Ashi RSI MT5: How to Read HARSI Candles (Gold Guide)
Learn how the Heikin Ashi RSI (HARSI) indicator for MT5 turns RSI into smooth candles, which settings to test, and how to read it…
Read more →
Trend Strength Index MT5: Is Gold’s Rebound Steady Before CPI?
Learn how the Trend Strength Index for MT5 shows how steady gold's rebound is before US CPI, with settings, signals and a step-by-step plan.…
Read more →
Convert MT4 EA to MT5: What OANDA’s MT4 Shutdown Means
Convert MT4 EA to MT5 before brokers like OANDA Japan switch off MT4. Learn what changes in MQL5, how to test it, and get…
Read more →Need a team that can design, build and maintain it all?
Let's talk. Tell us about your project and we'll reply with honest timelines.