Weis Wave Volume Indicator MT5: How to Read Waves on Gold
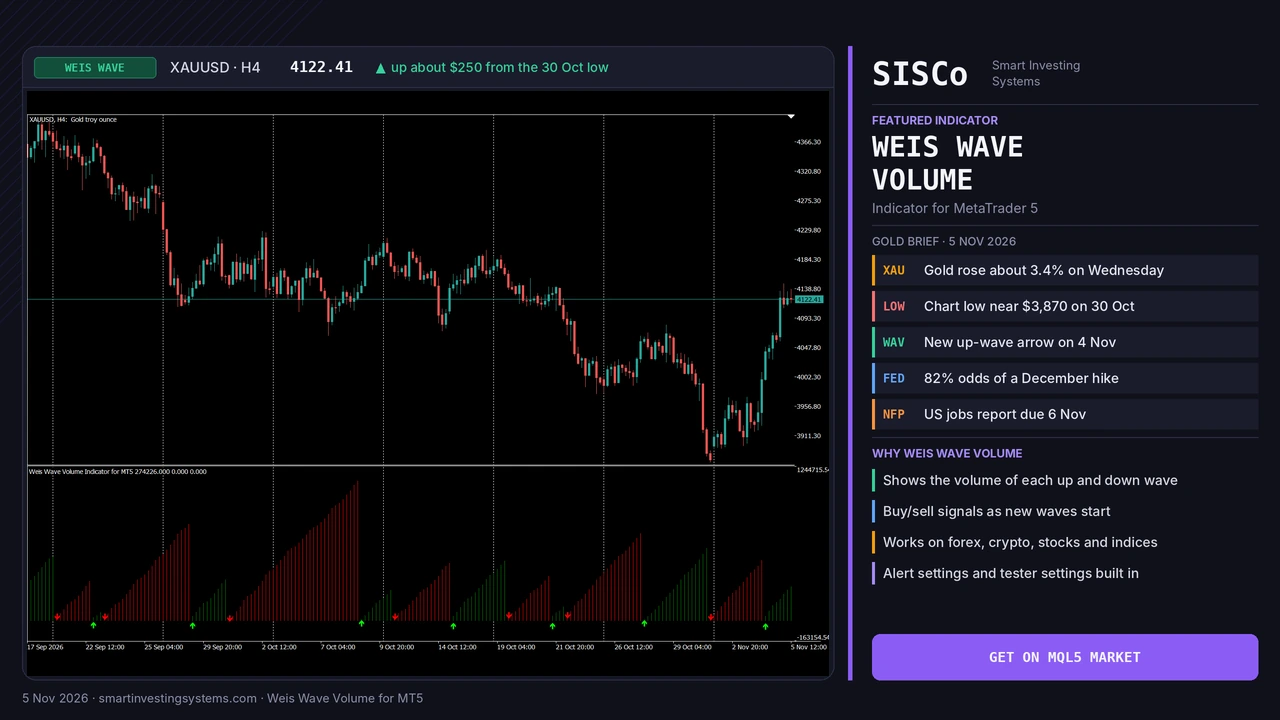
Gold jumped about 3.4% on Wednesday and pushed above $4,130 early on Thursday. A move that fast leaves every trader with the same question: is real participation behind it, or is the market running on thin air? Price alone cannot tell you. The Weis Wave Volume indicator for MT5 helps by adding up the volume of each complete price swing, so you can compare the effort behind one wave with the next. This guide explains how the indicator works, how to read effort against result, which settings to test, and how to apply it to XAUUSD step by step.
01What the Weis Wave Volume Indicator Does
The Weis Wave Volume Indicator for MT5 groups consecutive candles into up waves and down waves, then shows the volume of each wave. When a run of candles closes higher, it builds an up wave. When candles start closing lower, a down wave begins. A new up wave gives a buy signal and a new down wave gives a sell signal.
The idea comes from David Weis, a long-time educator in the Wyckoff tradition, who described it in his book Trades About to Happen. Wyckoff analysts care less about a single candle and more about how much work the market does across a whole swing. That is why this tool is a natural fit for anyone learning Wyckoff volume analysis on MT5.
Waves
Candles are grouped into up and down swings, so noise inside a swing matters less.
Wave volume
Volume is added up across each wave, showing how much effort went into that swing.
Signals and alerts
A new wave triggers a buy or sell signal, with alert settings and tester settings included.
02Why Wave Volume Beats a Normal Volume Histogram
A normal histogram shows volume per bar. That is useful for spotting one busy candle, but it makes swings hard to compare. A slow rally made of twenty quiet bars can carry more total volume than a sharp drop made of three loud bars, and a bar-by-bar view hides that.
Weis Wave Volume solves this by giving each swing one running total. Instead of asking “was this candle busy?”, you ask “did this swing take more or less effort than the last one in the same direction?” That is a far better question when you are judging a trend.
| Question | Normal volume | Weis Wave Volume |
|---|---|---|
| What is measured | Each bar on its own | Each up or down swing as a total |
| Best at showing | Single busy candles | Effort behind a whole move |
| Trend check | Hard to compare swings by eye | Compare wave columns directly |
| Breakout check | One candle’s volume | Does the breakout wave beat earlier waves? |
03Effort vs Result: The Four Readings That Matter
Effort vs result is the core of the method. Effort is the volume of the wave. Result is how far price travelled during that wave. Read the two together and four common situations appear.
High effort, big result
Large wave volume and a long move. Participation supports the swing, which favours continuation.
High effort, small result
Large wave volume but little price progress. Something is absorbing the move, so be careful about chasing it.
Low effort, big result
A long move on small wave volume. Price may have travelled through thin conditions, so look for confirmation.
Low effort, new extreme
A new high or low on a shrinking wave. The push may be losing steam, which often deserves a tighter plan.
These are readings, not mechanical rules. They carry the most weight at levels that already matter, such as prior swing points. Marking those levels with our Support and Resistance Levels Indicator keeps your wave comparison tied to clear locations on the chart.
04How to Read the Buy and Sell Signals
A signal simply tells you a new wave has started in that direction. It does not tell you the new wave will be strong. Treat it as the moment to start your check, not as the whole decision.
📈 Bullish signal
- A new up wave starts and a buy signal prints.
- The previous down wave was smaller than the down waves before it.
- Price is holding above a level you marked in advance.
- As it develops, the up wave grows larger than the last down wave.
📉 Bearish signal
- A new down wave starts and a sell signal prints.
- The previous up wave was smaller than the up waves before it.
- Price has failed at a level you marked in advance.
- As it develops, the down wave grows larger than the last up wave.
The same logic works for breakouts. If price clears a range, check whether the breakout wave carries more volume than the waves inside the range. If it does not, the breakout had less effort behind it than the range itself, and that is a reason for caution.
05Weis Wave Settings to Test
The indicator has two main inputs. Trend Detection Length sets the number of candles used to define a wave change. Downtrend Histograms lets you show bearish waves below zero, which many traders find easier to read. Lower Trend Detection Length values create more, shorter waves. Higher values create fewer, larger ones.
The values below are starting points to test on your own broker’s data. They are not product defaults or recommendations.
| Trading style | Timeframe | Trend Detection Length to test | Downtrend Histograms |
|---|---|---|---|
| Intraday | M15 | 4 to 6 | On |
| Day trading | H1 | 3 to 5 | On |
| Swing trading | H4 | 2 to 4 | On |
| Position trading | D1 | 2 to 3 | On |
A useful test: the waves on your chart should roughly match the swings you would mark by hand. If every small pullback becomes a wave, raise the length. If obvious swings merge into one column, lower it.
06How to Use Weis Wave Volume on Gold, Step by Step
This week gives you a live case to study. Spot gold rose about 3.4% on Wednesday, its biggest daily gain since 19 August, and traded near $4,134 early on Thursday, its highest level since 22 October. Yet CME FedWatch still showed an 82% chance of a December Fed rate hike, and the US jobs report is due on Friday, 6 November. A fast rally with a major data release ahead is exactly when wave volume is worth checking.
Set up the chart
Attach the indicator to XAUUSD on H4, turn on Downtrend Histograms and pick a Trend Detection Length from the table above.
Mark the key levels
Draw the swing high and low of recent weeks. Add the round $4,000 level that gold has been trading around.
Compare the waves
Is the latest up wave larger than earlier up waves and the down wave before it? A larger wave means this rally took more effort, not that it must continue.
Check the result
Divide the job into two parts: how big is the wave, and how far did price travel? Big effort with little progress near resistance is a warning.
Plan around the data
Decide your risk before the jobs release. Waves can change quickly around news, so wait for the wave to develop rather than reacting to the first candle.
The chart in this article’s banner shows this in practice. On XAUUSD H4, gold fell to a low near $3,870 on 30 October, then rebounded to about $4,122. The indicator printed a new up-wave arrow on 4 November. So far the current green wave is smaller than the red wave before it, even though price has moved sharply. That fits the low effort, big result reading from section 03, but the wave is still developing, so treat it as a reason to look for confirmation rather than a conclusion.
07Limits and Common Mistakes
Volume on forex and CFD symbols needs care. Spot markets such as XAUUSD have no single central tape, so MT5 charts usually show tick volume, which counts price updates rather than traded lots. It is a measure of activity in your broker’s feed. Waves are still useful for comparing swings on the same symbol and broker, but the numbers will differ between brokers.
Trading every signal. A new wave is not a trade on its own. Add location and a comparison with earlier waves.
Judging a live wave. The current wave is still adding volume, so compare it fairly only once it has developed.
Comparing across symbols. Wave sizes are only meaningful against other waves on the same chart and broker.
Ignoring the calendar. News can inflate a single wave, so read waves around major releases with extra care.
Want a second volume view? The Cumulative Delta Volume Indicator estimates buying and selling pressure as a running line, which pairs well with wave totals. If you have a Weis Wave rule you want to automate, our team can build it into a custom EA for you.
08Weis Wave Volume FAQ
What does the Weis Wave Volume indicator show?
It groups candles into up and down waves and shows the volume of each wave, so you can compare the effort behind consecutive swings.
Does Weis Wave Volume work on gold and forex in MT5?
Yes. The indicator works on forex, crypto, stocks, commodities and indices. Remember that many forex and CFD symbols use tick volume, so compare waves only on the same symbol and broker.
What does effort vs result mean?
Effort is the volume in a wave and result is the distance price moved. When a large wave produces little movement, that mismatch can warn that the move is being absorbed.
Can I test it before buying?
Yes. You can download a free demo from the MQL5 Market and run it in the MetaTrader 5 Strategy Tester before you buy.
See the Effort Behind Every Swing
Add Weis Wave Volume to your MT5 chart, try the free demo in the Strategy Tester, and start comparing waves on the markets you trade.
Trading involves risk and you can lose money. This article is for education only and is not financial advice.
Gold · indicators · mt5 · Weis Wave Volume · Wyckoff
Related articles
Heikin Ashi RSI MT5: How to Read HARSI Candles (Gold Guide)
Learn how the Heikin Ashi RSI (HARSI) indicator for MT5 turns RSI into smooth candles, which settings to test, and how to read it…
Read more →
Trend Strength Index MT5: Is Gold’s Rebound Steady Before CPI?
Learn how the Trend Strength Index for MT5 shows how steady gold's rebound is before US CPI, with settings, signals and a step-by-step plan.…
Read more →
Convert MT4 EA to MT5: What OANDA’s MT4 Shutdown Means
Convert MT4 EA to MT5 before brokers like OANDA Japan switch off MT4. Learn what changes in MQL5, how to test it, and get…
Read more →Need a team that can design, build and maintain it all?
Let's talk. Tell us about your project and we'll reply with honest timelines.