Stochastic OTT Indicator for MT5
Stochastic OTT for MetaTrader 5 combines Stochastic and Optimized Trend Tracker calculations into two bands for clearer trend and entry signals.
- MetaTrader 5
- Works on VPS
- Lifetime support
About Stochastic OTT Indicator for MT5
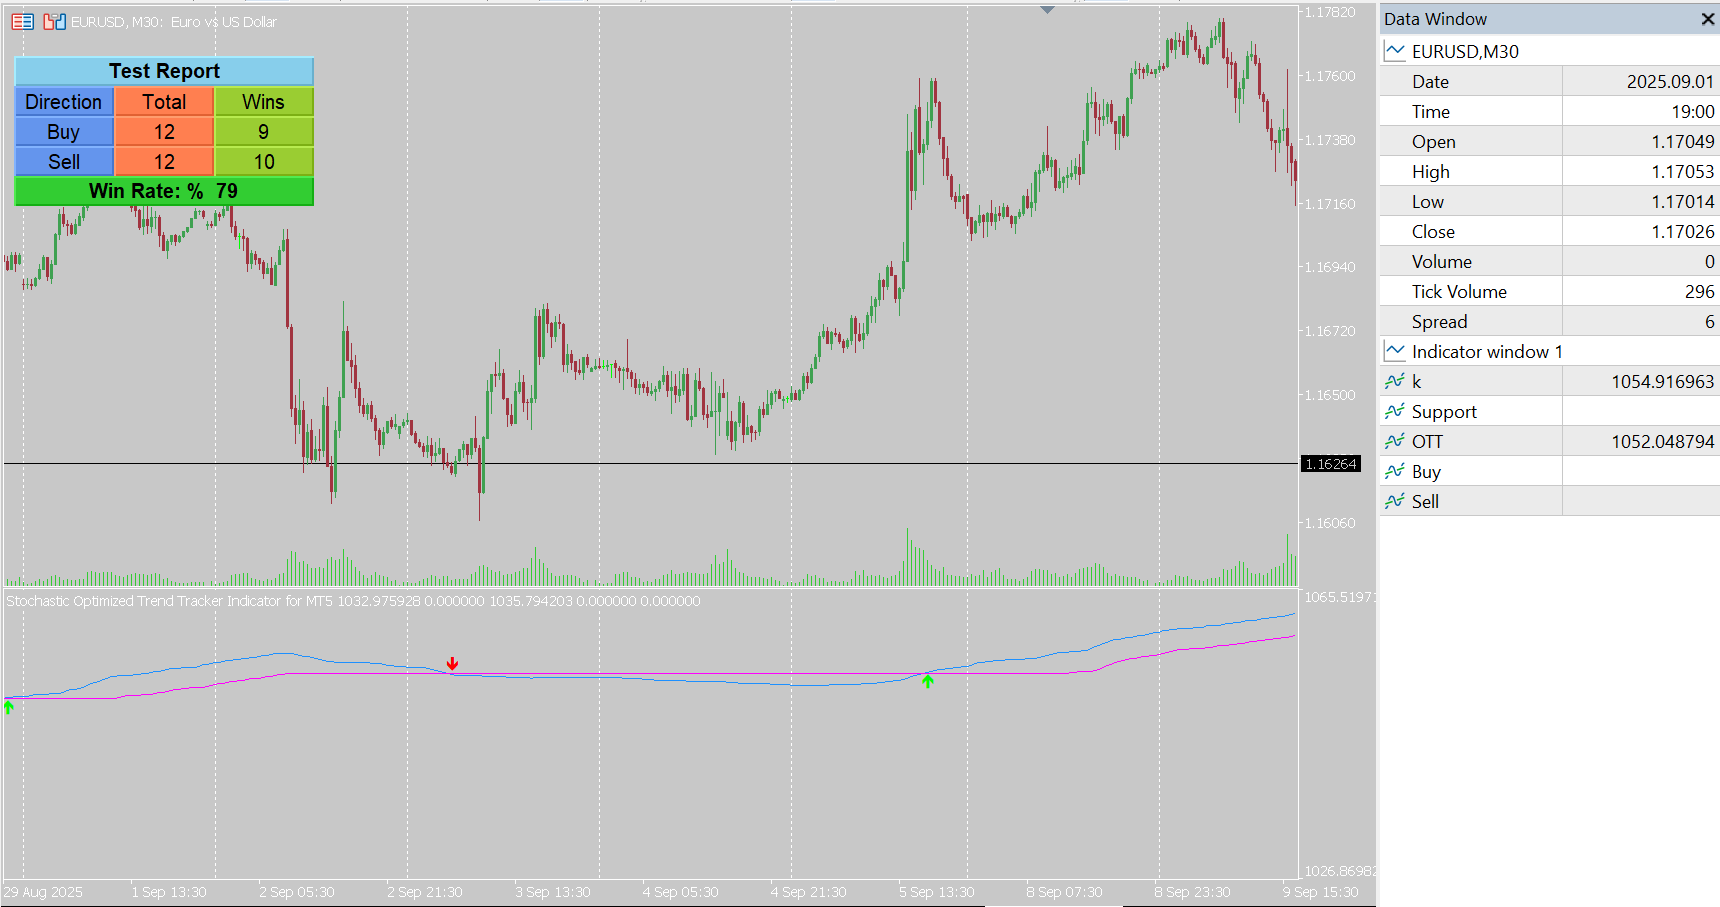
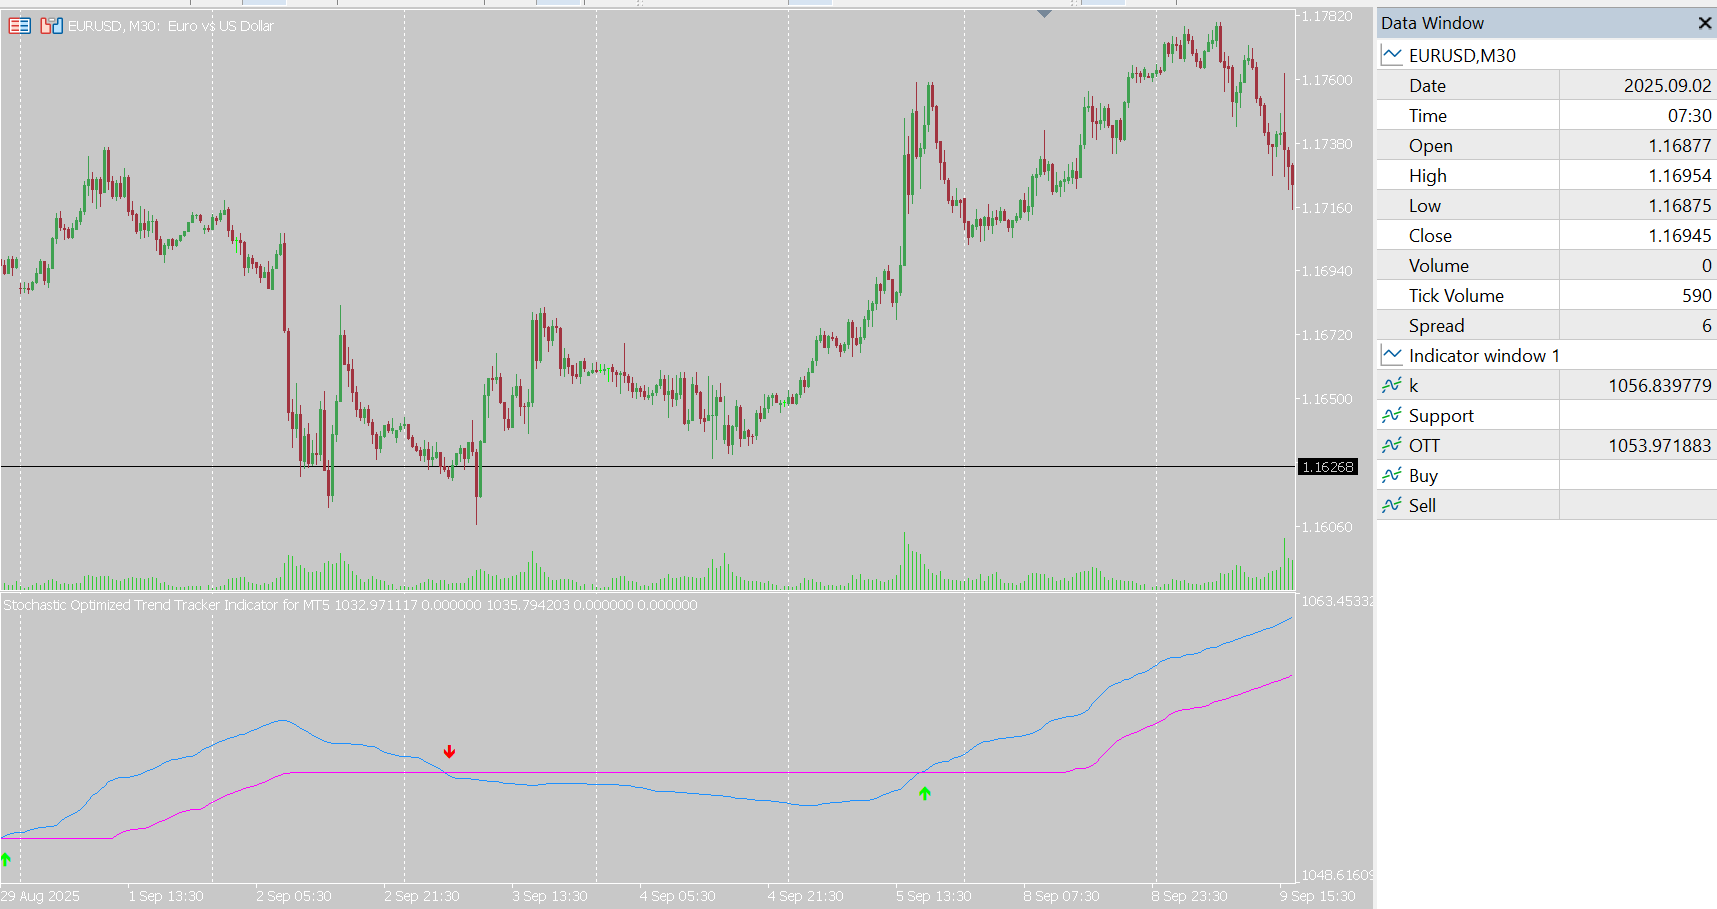
In short: Stochastic OTT for MetaTrader 5 plots two bands, one from Stochastic and one from the Optimized Trend Tracker (OTT), and gives a signal each time they cross. It combines momentum and trend-following in a single window.
Two ideas combined
Stochastic measures where price closed within its recent range, which is a fast momentum reading. OTT, the Optimized Trend Tracker, is a trend-following line built from an optimized moving average and an adaptive volatility offset. Stochastic OTT applies the OTT calculation to the Stochastic output, so you get one band that is the raw momentum reading and a second that is a trend-tracked version of it. When they cross, momentum and trend-tracking have changed relationship, and that is the signal.
How to read it
- Crossover: the main signal. Whenever the Stochastic band and the OTT band cross, the indicator generates a signal.
- Trend shifts and pullbacks: because OTT adapts to momentum, crossovers can show a change in trend direction or the end of a pullback.
- Support line: an optional extra line very close to the Stochastic band, useful as a visual reference for how tightly price is following momentum.
It works on all timeframes, so you can use the same logic from scalping charts to daily charts.
Settings explained
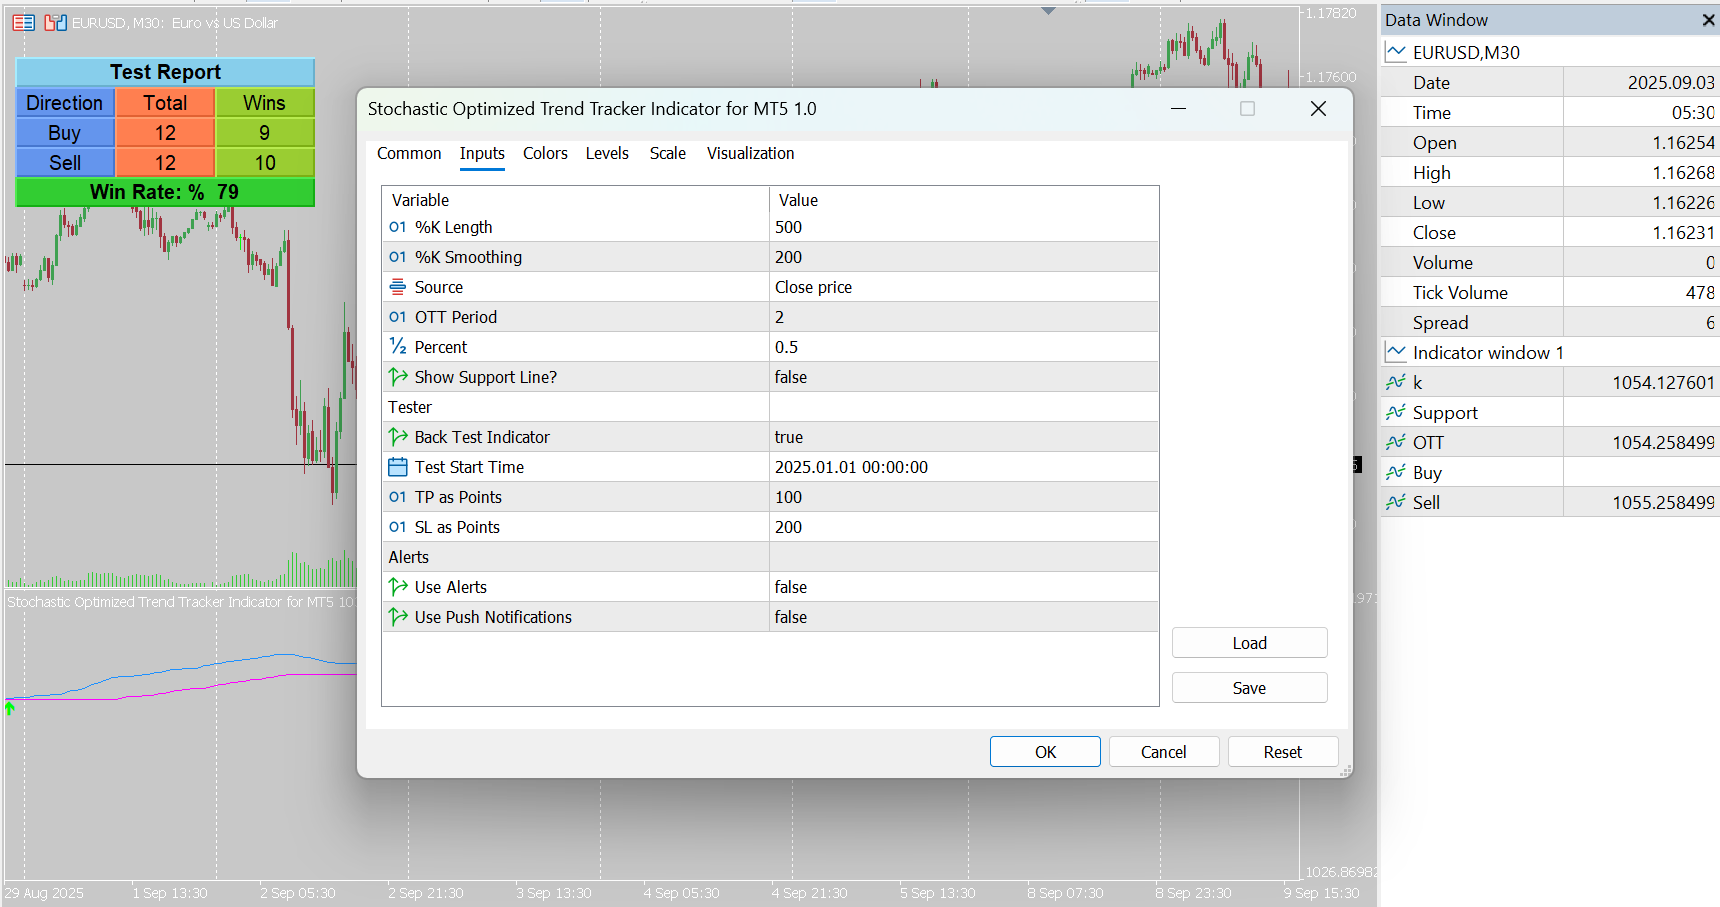
- %k Length – the %k period for the blue band.
- %k Smoothing – the smoothing period for the blue band.
- Source – the price source used.
- OTT period – the period of the OTT calculation.
- Percent – the percent factor of the OTT.
- Show support line – displays the additional line close to the Stochastic band.
- Tester and alert parameters – for the tester dashboard, chart alerts and phone notifications.
A shorter %k Length makes the Stochastic band more reactive, with more crossovers; a longer one gives fewer, slower signals. A higher Percent keeps the OTT band further from its baseline. Check a few combinations on your chart before trading live.
A practical way to use it
- Take your direction from the higher timeframe.
- Trade crossovers in that direction and treat crossovers against it as weak.
- Confirm with price action or structure rather than relying on the crossover alone.
- Use the tester dashboard to see how the settings would have performed on your symbol.
Related OTT-based tools
If you like the OTT approach, compare this indicator with the Optimized Trend Tracker Oscillator (OTTO), which applies the OTT logic to an adaptive oscillator, and the PMAX indicator.
Frequently asked questions
What is the Stochastic OTT indicator?
It plots two bands on the same indicator window: one based on Stochastic and one based on OTT (Optimized Trend Tracker). A signal is generated whenever the two bands cross.
What does the Percent setting do?
It is the percent factor of the OTT calculation, which sets how far the trend-stop line sits from its baseline.
What do %k Length and %k Smoothing control?
%k Length is the Stochastic period for the blue band, and %k Smoothing is the period used to smooth that band.
What is the support line?
An optional extra line that sits very close to the Stochastic band. You can show or hide it with the Show support line setting.
Can I use it in an Expert Advisor?
Yes. It exposes buffers that your own or a custom EA can use.
Does it have alerts and a tester?
Yes. Alerts on the chart and push notifications to your phone, plus a tester dashboard with its own parameters.
Is there a free demo?
Yes. Download the free demo from the MQL5 Market and run it in the MetaTrader 5 Strategy Tester before buying.
Stochastic OTT is an analysis tool and does not guarantee trading results.
Ready to try Stochastic OTT Indicator for MT5?
Download it from the MQL5 Market and attach it to your MetaTrader 5 chart in minutes.
Want it customized or need something similar? Request a free quoteTrading involves risk. Our indicators are analysis tools for educational and informational purposes and do not constitute financial advice. Read our Disclaimer.
More indicators

Ultimate RSI Indicator for MT5
The Ultimate RSI for MetaTrader 5 gives a more adaptive, dynamic view of market momentum than the classic RSI. Settings, signals and video demo.
View details →
Volume Flow Indicator for MT5
The Volume Flow Indicator for MetaTrader 5 tracks money flow from price and volume on all timeframes to confirm trends and spot divergences.
View details →
Kagi Chart MT5 – True Price Action Indicator
KagiChart draws time-independent Kagi lines on your MetaTrader 5 chart, focusing on price movement and reversal structure instead of time.
View details →