Ultimate RSI Indicator for MT5
The Ultimate RSI for MetaTrader 5 gives a more adaptive, dynamic view of market momentum than the classic RSI. Settings, signals and video demo.
- MetaTrader 5
- Works on VPS
- Lifetime support
See it on the chart
About Ultimate RSI Indicator for MT5
In short: the Ultimate RSI for MetaTrader 5 compares directional price changes with the total price range, so it adapts to range expansions and contractions, and lets you choose EMA, SMA, RMA or TMA smoothing for both the RSI and its signal line.
What is different about it
The standard RSI looks at the balance of gains and losses and nothing else. The Ultimate RSI adds range normalization: it compares directional price changes against the total price movement range. When the range expands, the reading adjusts for that, and when it contracts, it adjusts the other way. The goal is an oscillator that responds faster, lags less and is less thrown by changes in volatility.
Choose your smoothing
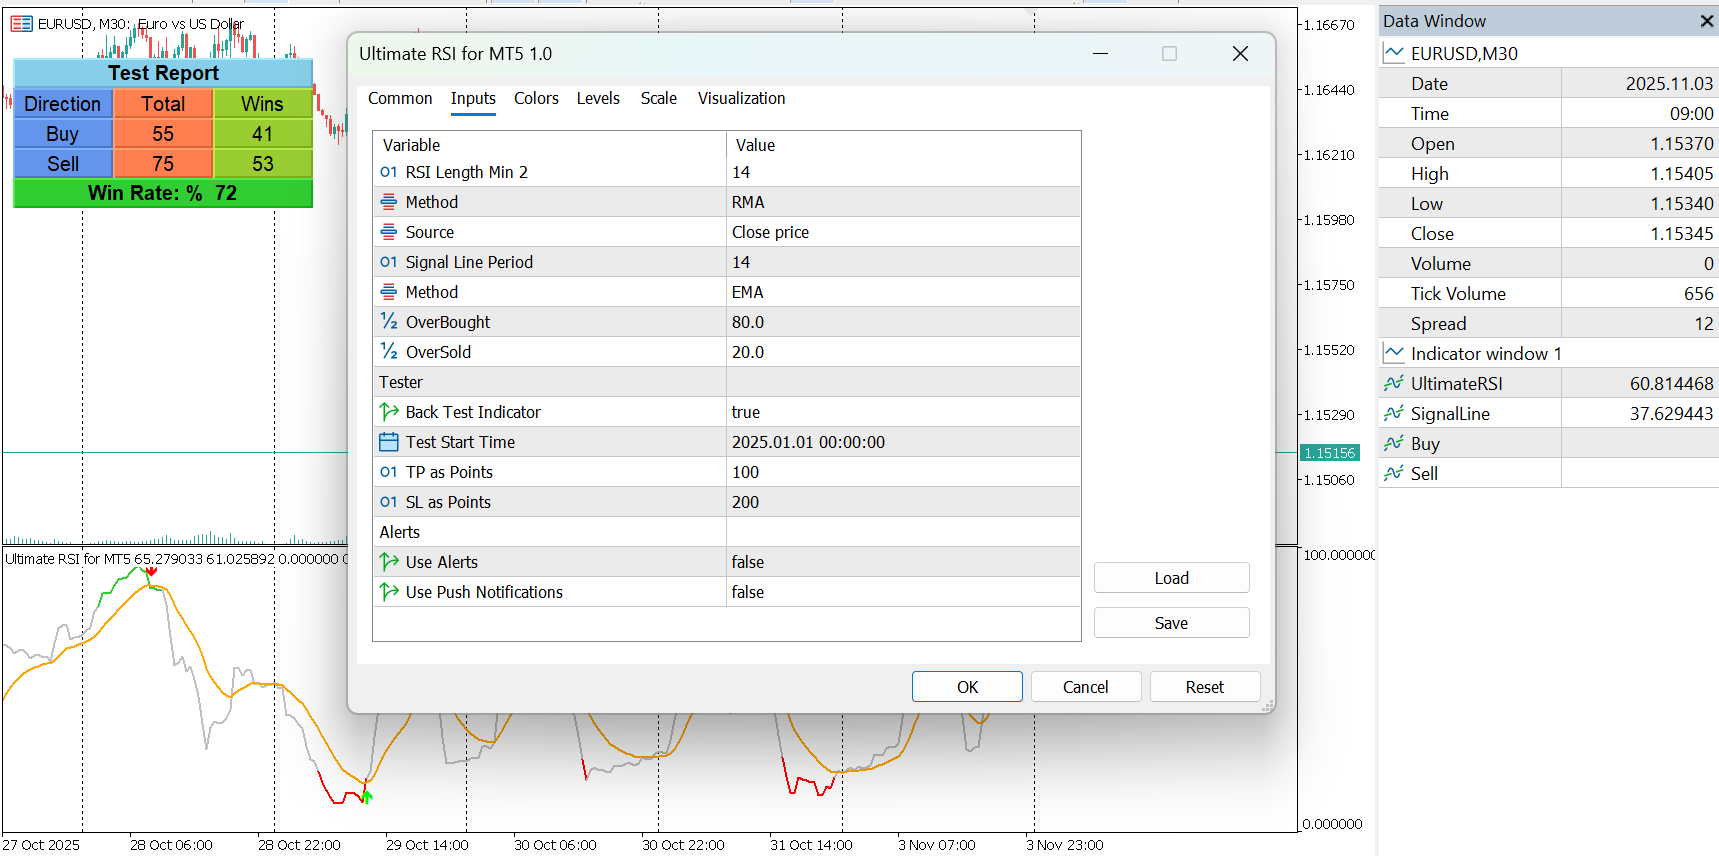
For both the RSI base and the signal line you can choose from four averaging methods:
- EMA – reacts quickly to recent data.
- SMA – equal weight, smoother and slower.
- RMA – a slower, smoothed average of the type used in Wilder’s classic RSI.
- TMA – a triangular average, very smooth.
This lets you tune the oscillator between smoothness and reactivity, for example a fast EMA for scalping or a smooth TMA for swing charts.
Reading the chart
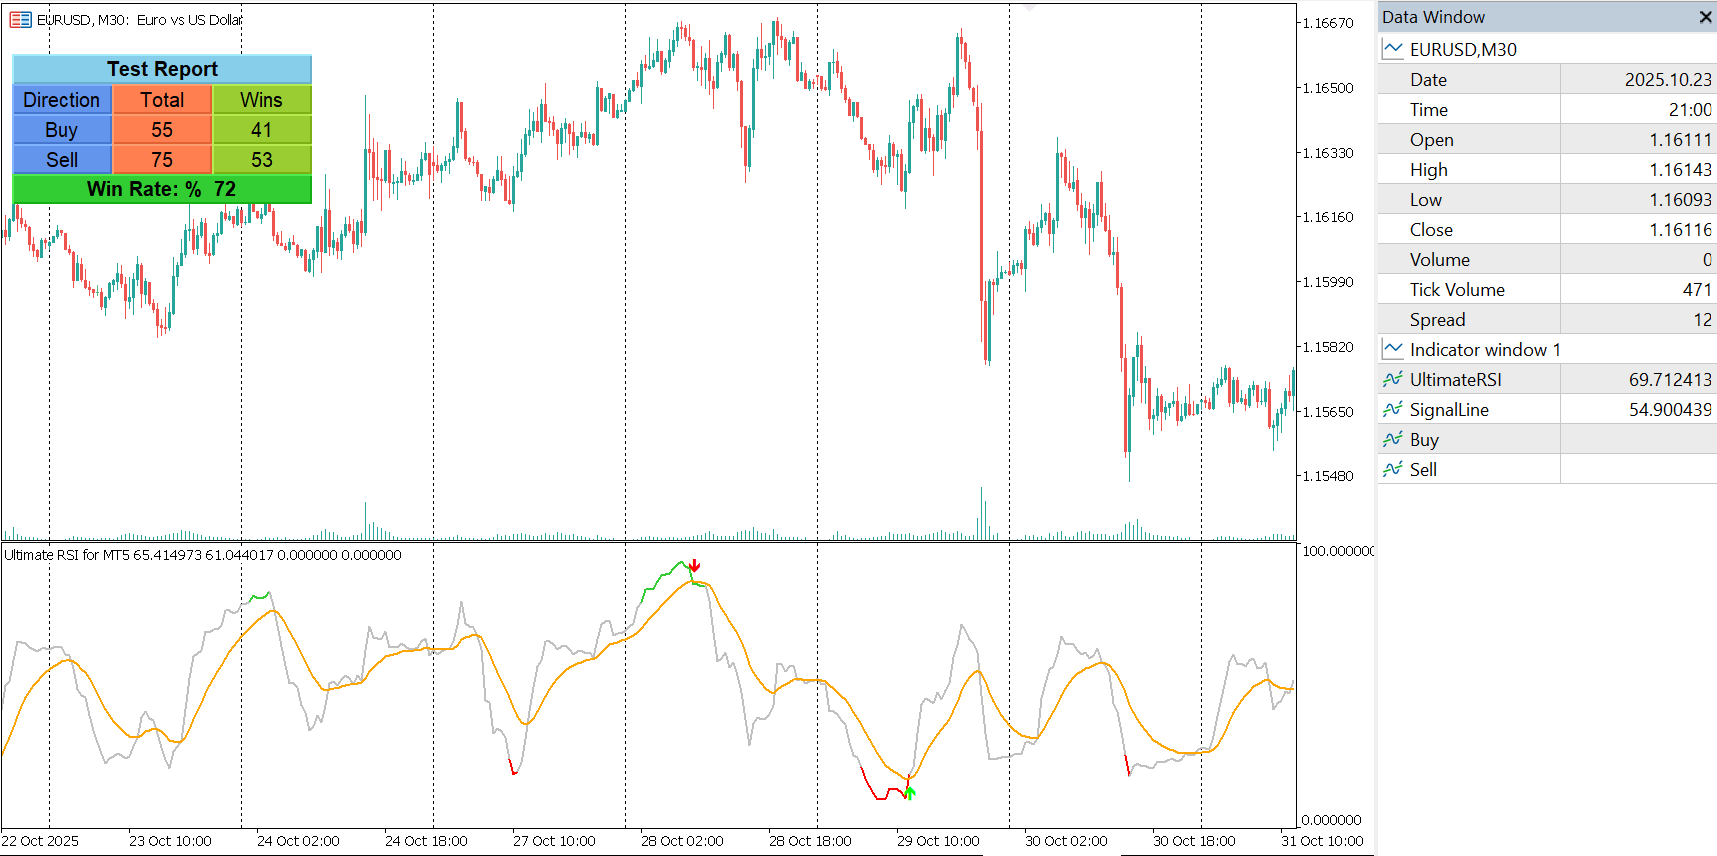
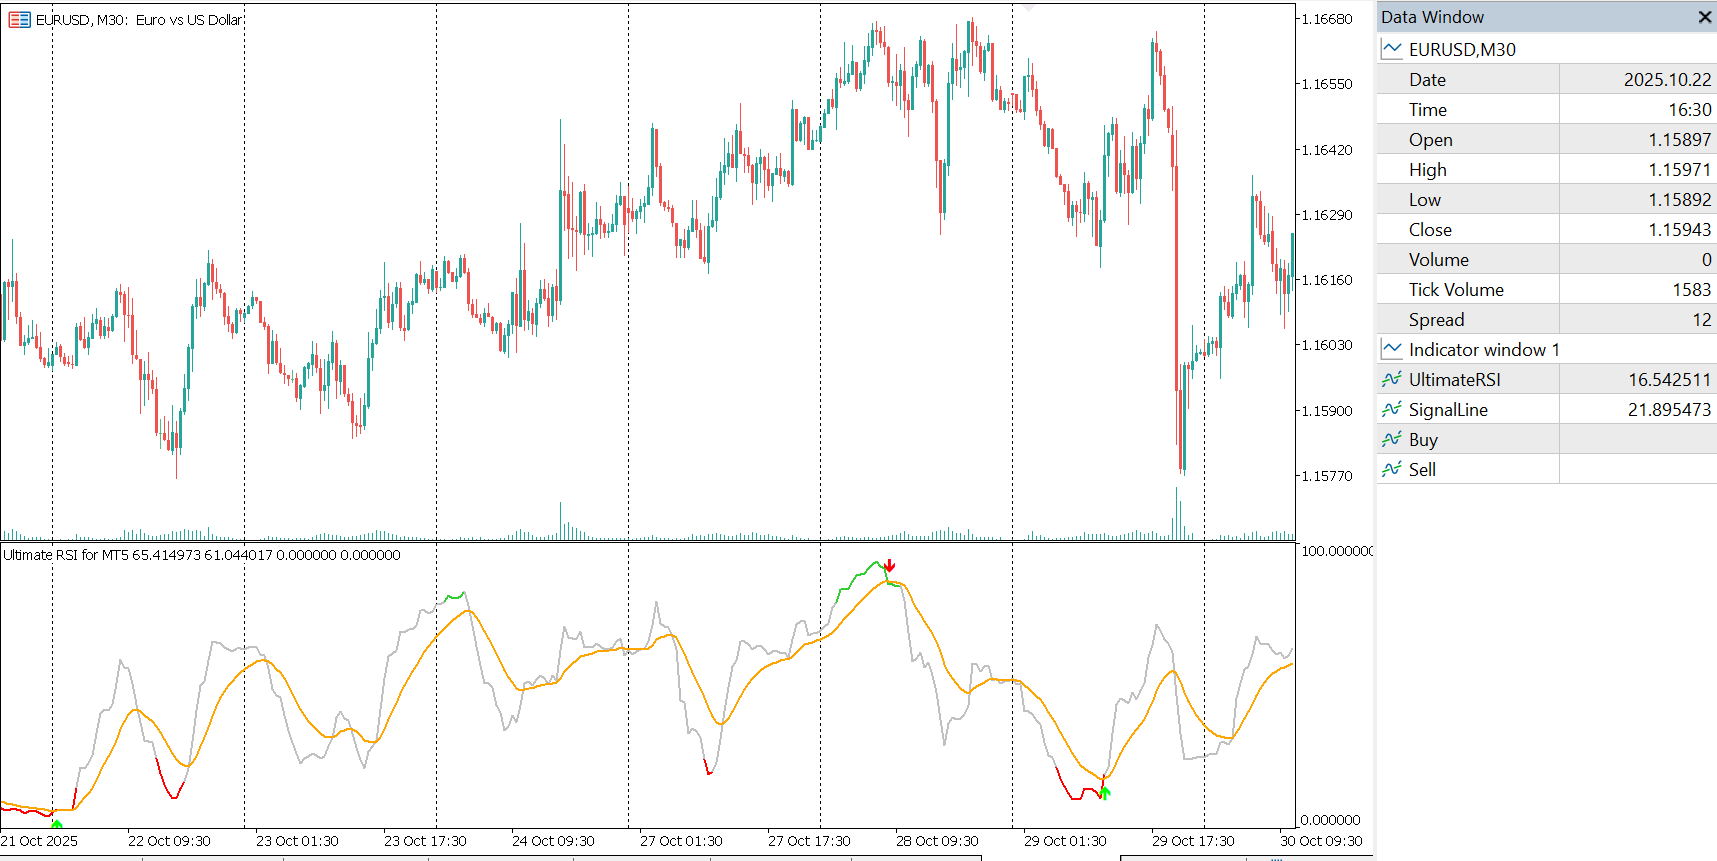
- Overbought and oversold zones are shaded with a gradient, so you can see at a glance how stretched the market is.
- Midline at 50 gives a directional bias: above 50 is bullish, below is bearish.
- Signal line helps identify momentum shifts when the RSI crosses it.
- Automatic color adaptation keeps the indicator readable on different chart themes.
Ways to trade it
- Reversals: look for turns near the overbought and oversold zones.
- Continuation: when the RSI and the signal line align in the direction of the trend, that can mark a continuation.
- Directional filter: use the 50 line to decide whether to look for longs or shorts.
Use it by itself or pair it with price action tools for confirmation.
Built for automation
All calculations run in indicator buffers, with no graphical objects. This keeps processing fast and makes the indicator easy to read from an Expert Advisor.
Compare RSI variants
If you are choosing between RSI-style tools, also look at the Laguerre RSI, which smooths RSI with a Laguerre filter, and the Smart Multi RSI.
Frequently asked questions
How is the Ultimate RSI different from the standard RSI?
The standard RSI measures relative price strength only. The Ultimate RSI also adjusts to recent range expansions and contractions by comparing directional price changes with the total price movement range, which makes it more adaptive and responsive.
Which smoothing methods can I use?
EMA, SMA, RMA or TMA, selectable separately for the RSI base and for its signal line.
What is the signal line for?
It helps identify momentum shifts. Continuation signals appear when the RSI and the signal line align, and reversals are often found near the overbought and oversold zones.
How are overbought and oversold zones shown?
As visually shaded regions with gradient shading, and the colors adapt automatically for better chart visibility. A midline at 50 helps track directional bias.
Can I use it in an EA?
Yes. Everything is computed in buffers with no graphical objects, so it is fast and ideal for EA or strategy integration through direct buffer access.
Is there a free demo?
Yes. Download the free demo from the MQL5 Market and run it in the MetaTrader 5 Strategy Tester before buying.
The Ultimate RSI is an analysis tool and does not guarantee trading results.
Ready to try Ultimate RSI Indicator for MT5?
Download it from the MQL5 Market and attach it to your MetaTrader 5 chart in minutes.
Want it customized or need something similar? Request a free quoteTrading involves risk. Our indicators are analysis tools for educational and informational purposes and do not constitute financial advice. Read our Disclaimer.
More indicators

Heiken Ashi RSI Indicator for MT5
HARSI combines Heikin Ashi smoothing with RSI momentum in MetaTrader 5 for a cleaner, dual-layer view of price direction and strength.
View details →
Pmax Indicator for MT5
PMax for MetaTrader 5 combines ATR with your choice of moving average (SMA, EMA, ZLEMA and more) to follow trends and flag reversals.
View details →
Weis Wave Volume Indicator for MT5
Weis Wave Volume for MetaTrader 5 groups volume into up and down waves, combining price action and volume to show who controls the market.
View details →