Laguerre RSI MT5: Settings, Gamma and Gold Strategy Guide
The Laguerre RSI is the answer for traders who like RSI but hate its lag and its noise. A normal 14-period RSI either reacts late or jumps around on every candle. The Laguerre RSI uses a four-stage filter to give you a smooth line that still turns early, controlled by one setting called Gamma. This guide explains how it works, how to set Gamma and the overbought/oversold levels, and how to use it on a live example: gold slipping back below $4,000 ahead of this week’s Fed decision.
01What the Laguerre RSI actually is
The Laguerre RSI was introduced by John Ehlers, an engineer who applied signal-processing ideas to trading. Instead of averaging gains and losses over a fixed number of bars like the classic RSI, it runs price through a four-stage Laguerre filter. Each stage is a slightly delayed, smoothed copy of price. The indicator then compares how many of those stages are rising versus falling and turns that into an RSI-style reading.
The practical result: you get the smoothness of a long-period RSI with much less delay. In our Laguerre RSI Indicator for MT5, the line is also colourised by momentum direction, and the indicator plots buy and sell arrows at key turning points confirmed by its internal smoothing logic, so you are not left guessing where a turn happened.
Smooth, not slow
The Laguerre filter removes small wiggles without needing a long lookback period, so turns show up earlier than on a heavily smoothed RSI.
One main dial
Gamma controls the whole personality of the line. You tune one number instead of juggling periods and extra averages.
Clear extremes
Because the line is cleaner, overbought and oversold readings stand out with less noise than a standard RSI.
02Laguerre RSI vs standard RSI
A standard RSI has one main problem: smoothness and speed fight each other. To make a 14-period RSI calmer you raise the period, and every bar you add makes it react later. The Laguerre RSI breaks that trade-off by smoothing through the filter instead of through a longer lookback.
| Feature | Standard RSI | Laguerre RSI |
|---|---|---|
| How it smooths | Longer period (more bars) | Four-stage Laguerre filter |
| Main setting | Period | Gamma |
| Typical behaviour | Choppy at short periods, laggy at long periods | Smooth line that still turns early |
| Extra smoothing | Usually needs a separate moving average | Optional built-in EMA smoothing (set to 1 to turn off) |
| Best use | General momentum reading | Timing pullbacks and turning points |
If you want to compare other RSI-based approaches, the Ultimate RSI and the Heikin Ashi RSI take different routes to the same goal of a cleaner momentum line.
03Understanding Gamma: the setting that matters most
Gamma sets the strength of the Laguerre filter. In Ehlers’ formula it is a value between 0 and 1. The rule is simple and is stated in the product’s own settings: higher Gamma makes the line smoother and slower to react; lower Gamma makes it faster and more sensitive.
- Low Gamma: the line swings quickly between extremes. Good for scalping and short-term timing, but it will produce more signals, including more false ones.
- Middle Gamma: a balance between speed and smoothness. A sensible place to start on H1 and H4 charts.
- High Gamma: the line spends longer in each zone and turns only on bigger swings. Better for swing trading and noisy markets.
The indicator also has a Smoothing input that adds extra exponential moving average smoothing on top of the Laguerre line. Set it to 1 to turn it off. A good habit is to tune Gamma first with Smoothing at 1, and only add smoothing if the line is still too jumpy for your timeframe.
04Settings: starting points to test
There is no single “best” Laguerre RSI setting. The table below gives starting points to test, not recommendations. Begin with the indicator’s default Gamma, then move it in small steps and compare results in the Strategy Tester before trading anything live.
| Style | Timeframe | Gamma (starting point) | Smoothing | Levels |
|---|---|---|---|---|
| Scalping | M5–M15 | Below default (faster) | 1 (off) | Default Over Bought / Over Sold |
| Intraday | M30–H1 | Default | 1 (off), add a little if noisy | Default |
| Swing | H4–D1 | Above default (smoother) | Light smoothing | Slightly wider levels to catch only true extremes |
| Volatile markets (gold, crypto) | H1–H4 | Above default | Light smoothing | Wider levels |
Two more inputs are worth knowing. Over Bought and Over Sold set the zone lines: values above Over Bought may signal potential sell zones and values below Over Sold may signal potential buy zones. And Use Alerts and Use Push Notifications let the indicator notify you on screen or on your MetaTrader mobile app when a signal appears.
05How to read Laguerre RSI signals
The Laguerre RSI works best when you read it with the trend, not against it. An oversold reading in a strong downtrend is not a buy on its own; it often just means the selling is strong. The signals below combine the line with basic trend context.
📈 Bullish signal
- Higher-timeframe trend is up (price above a rising moving average or making higher lows).
- Laguerre RSI drops into the Over Sold zone on a pullback.
- The line turns up and its colour changes, or a buy arrow prints.
- Stop goes below the pullback low.
📉 Bearish signal
- Higher-timeframe trend is down (lower highs, price below a falling average).
- Laguerre RSI rallies into the Over Bought zone.
- The line turns down and changes colour, or a sell arrow prints.
- Stop goes above the bounce high.
In a strong trend the line can stay pinned at an extreme for many bars. Treat that as a sign of strength, not as an automatic reversal signal.
As with any indicator, readings on the bar that is still forming move with price. Wait for the candle to close before acting on a signal.
06A current example: gold below $4,000 before the Fed
Gold gives a good live test case this week. Spot gold fell below $4,000 an ounce on Friday, 23 October, for the first time since mid-July, after a weekly drop of about 4%, as a rally in oil and rising bets on further Fed tightening raised the cost of holding a metal that pays no yield (24/7 Wall St., FinanceFeeds). On Tuesday, the first day of the Fed’s 27–28 October meeting, it was hovering just around the $4,000 mark, with markets widely expecting the Fed to hold rates on Wednesday and focusing on what Chair Kevin Warsh signals for December.
This is exactly the kind of market where the Laguerre RSI’s settings matter. A downtrend that has lasted a full week means a fast Laguerre RSI on H1 will keep hitting Over Sold and flashing buy arrows, while price keeps falling. A trader using the rules above would do three things differently:
- Respect the trend: while the H4 trend is down, focus on sell signals when the line bounces into Over Bought, not on every oversold dip.
- Slow the line down: raise Gamma on H1 for a news-heavy week so that only larger swings trigger signals.
- Stand aside around the decision: a Fed announcement can move gold sharply in seconds, so momentum readings just before it are less reliable.
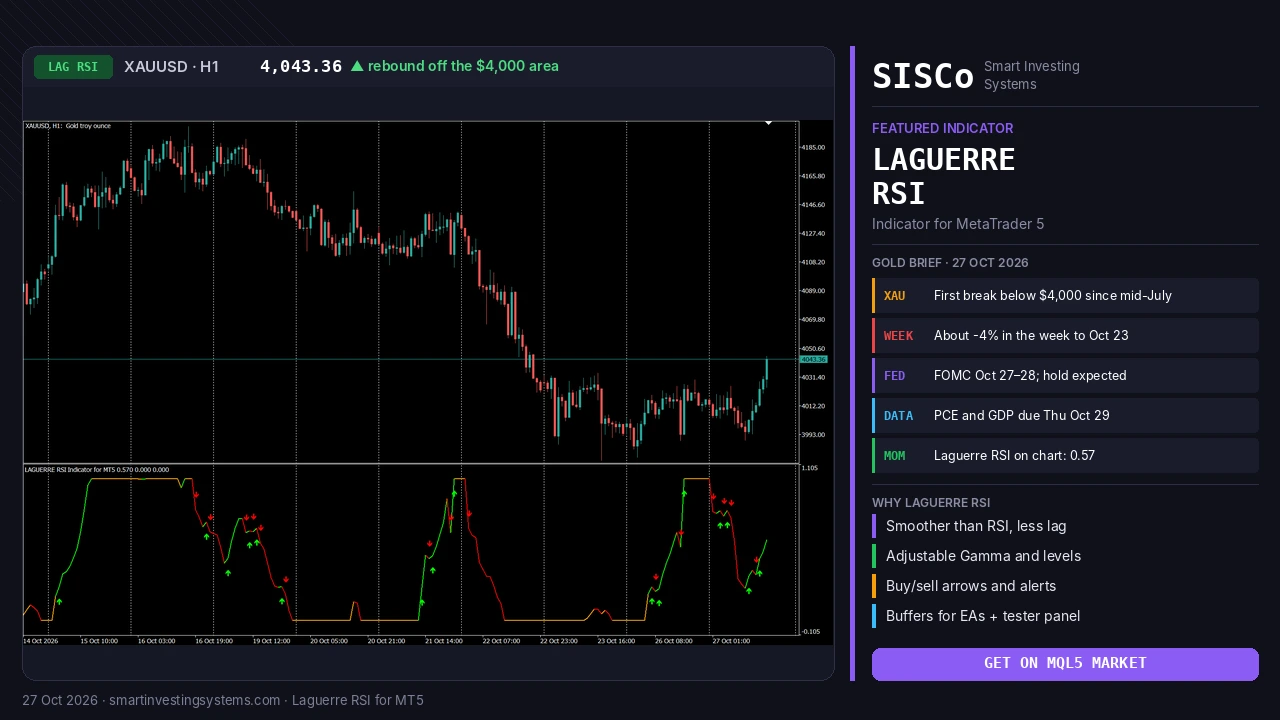
On the XAUUSD H1 chart from 14 to 27 October, gold slid from around 4,190 to the 4,000 area. During the drop the Laguerre RSI spent long stretches flat at the oversold floor, which is the pinned-at-an-extreme behaviour described above, and buy arrows there did not stop the fall at first. The latest reading, as price rebounded to 4,043.36, was about 0.57 and rising.
Nothing here is a forecast. The point is that the same indicator gives very different results depending on whether you use it with the trend or against it, and on whether Gamma suits the volatility.
07Step-by-step: set up and test the Laguerre RSI in MT5
Install the free demo
Download the demo from the MQL5 Market and attach it to a chart in the MetaTrader 5 Strategy Tester, where the demo runs.
Start with defaults
Leave Gamma at its default and set Smoothing to 1 so you see the raw Laguerre line first.
Pick your market and timeframe
For example XAUUSD on H1. Mark the higher-timeframe trend on H4 so you know which signals to favour.
Tune Gamma and levels
Raise Gamma if the line flips too often; lower it if signals come too late. Widen Over Bought and Over Sold for volatile markets.
Compare in the tester panel
Turn on Use Tester, set Test Start Time, TPpoints and SLpoints, and compare settings side by side. Then forward-test on a demo account before risking real money.
Because the indicator exposes its buffers, you can also read its values from your own Expert Advisor. If you want a fully automated strategy built around the Laguerre RSI, with your own filters, money management and licensing, our team can build a custom EA for you.
08Common mistakes to avoid
Fading strong trends
Buying every oversold reading in a falling market is the fastest way to lose with any RSI. Trade with the trend.
Over-optimising Gamma
A Gamma that looks perfect on one month of data rarely stays perfect. Test across different market conditions.
Stacking smoothing
High Gamma plus heavy Smoothing can make the line as late as the indicator you were trying to replace.
Ignoring news
Central-bank decisions and big data releases can override any momentum signal. Know the calendar.
Frequently asked questions
What is a good Gamma for the Laguerre RSI?
There is no universal value. Start with the indicator’s default, raise Gamma for a smoother and slower line, lower it for faster reactions, and confirm the choice in the Strategy Tester for your market and timeframe.
Is the Laguerre RSI better than the normal RSI?
It is not “better” in every case, but it solves the classic RSI trade-off between smoothness and lag. Traders who time pullbacks and turning points often find it cleaner to read.
Can I use the Laguerre RSI on gold and crypto?
Yes. It is built for forex, crypto and stock charts on any timeframe in MT5. For volatile markets like gold and bitcoin, a higher Gamma and wider levels are reasonable starting points to test.
Can I use it in an Expert Advisor?
Yes. The indicator provides buffers that an EA can read, so you can build automated rules around its values and signals.
Try the Laguerre RSI on your own charts
Get the Laguerre RSI Indicator for MT5 with adjustable Gamma, optional smoothing, buy/sell arrows, alerts, push notifications and a built-in tester panel. Download the free demo from the MQL5 Market and test it in the Strategy Tester before you decide.
Trading involves risk, and you can lose more than you expect. This article is for education only and is not financial advice.
Gold · indicators · Laguerre RSI · mt5 · RSI
Related articles
Heikin Ashi RSI MT5: How to Read HARSI Candles (Gold Guide)
Learn how the Heikin Ashi RSI (HARSI) indicator for MT5 turns RSI into smooth candles, which settings to test, and how to read it…
Read more →
Trend Strength Index MT5: Is Gold’s Rebound Steady Before CPI?
Learn how the Trend Strength Index for MT5 shows how steady gold's rebound is before US CPI, with settings, signals and a step-by-step plan.…
Read more →
Convert MT4 EA to MT5: What OANDA’s MT4 Shutdown Means
Convert MT4 EA to MT5 before brokers like OANDA Japan switch off MT4. Learn what changes in MQL5, how to test it, and get…
Read more →Need a team that can design, build and maintain it all?
Let's talk. Tell us about your project and we'll reply with honest timelines.