Fibonacci Bollinger Bands MT5: Bitcoin’s $79K Range Before Fed
Bitcoin has spent the start of this week pinned near $79,000–$80,000, with a Fed decision, a heavy data calendar and a large options expiry all landing before Friday. When a market is boxed in like this and waiting for news, the hard part is not predicting the direction. It is knowing where the range really ends, and when a move is a genuine breakout rather than another fake-out. This guide shows how to read that with the Fibonacci Bollinger Bands indicator for MT5 on a BTCUSD chart, step by step.
01Why Bitcoin traders are watching $79,000 this week
Bitcoin slipped to a five-week low around $79,100 over the weekend, after failing to hold a push toward $85,000 the week before, according to crypto.news. On Monday, Saxo’s Market Quick Take had BTC near $79,350, with US spot Bitcoin funds seeing about $773 million of net outflows on 22 and 23 October.
Three events sit right on top of that level:
FOMC, 27–28 October
The Fed is widely expected to hold rates at 3.75%–4.00% on Wednesday. The focus is on what it signals about a possible December hike.
PCE and GDP, 29 October
September PCE inflation and the advance Q3 GDP estimate land on Thursday, the day after the Fed.
Options expiry, 30 October
More than $11 billion of Bitcoin options expire on Friday, a known source of pinning and sharp moves around big strikes.
Analysts quoted in these reports frame $79,000–$80,000 as support and $82,000, then $84,000–$85,000, as resistance. That is a classic event-driven range. Price can chop inside it for days and then move hard once the news is out, which is exactly the kind of market a volatility band tool is designed for.
02What the Fibonacci Bollinger Bands indicator shows
Standard Bollinger Bands draw one upper and one lower band around a moving average, based on standard deviation. The Fibonacci Bollinger Bands indicator for MetaTrader 5 replaces those two lines with six bands spaced at Fibonacci ratios of the standard deviation. Instead of a single “too high” or “too low” line, you get graded levels above and below the average.
- Inner bands act as graded support and resistance, so you can see how deep a pullback is inside a range.
- Outer bands mark the edge of normal volatility. The indicator generates a buy or sell signal when price breaks above the highest band or below the lowest band.
- Customisable levels: the Bollinger Bands length, price mode (Close, Open, High or Low), band multiplier and all six Fibonacci levels can be changed.
- Alerts: on-chart alerts and push notifications for band breakouts, plus parameters for optimisation in the Strategy Tester.
Because the bands are built from volatility, they widen when Bitcoin is moving fast and contract when it goes quiet. In a pre-Fed range, that contraction is useful information in itself.
03Reading a range market with six bands
In a sideways market like this week’s BTCUSD, the bands do two separate jobs. Inside the range, the inner Fibonacci bands show where price is relative to “normal” movement. At the edges, the outer bands tell you when price has left that normal envelope.
📈 Bullish signal
- Price closes above the highest band, which is the indicator’s buy signal.
- The close also clears a known resistance area, such as $82,000.
- The bands are widening, showing volatility is expanding in the breakout direction.
- The next candle holds above the middle of the upper band group rather than falling straight back.
📉 Bearish signal
- Price closes below the lowest band, which is the indicator’s sell signal.
- The close also breaks a key support area, such as $79,000.
- The bands are widening as price falls, rather than staying flat.
- A retest of the broken band from below fails to get back inside.
Touches of the inner bands without a close beyond the outer band are not signals. In a range they are simply where price tends to slow down, which helps with stop and target placement rather than entries.
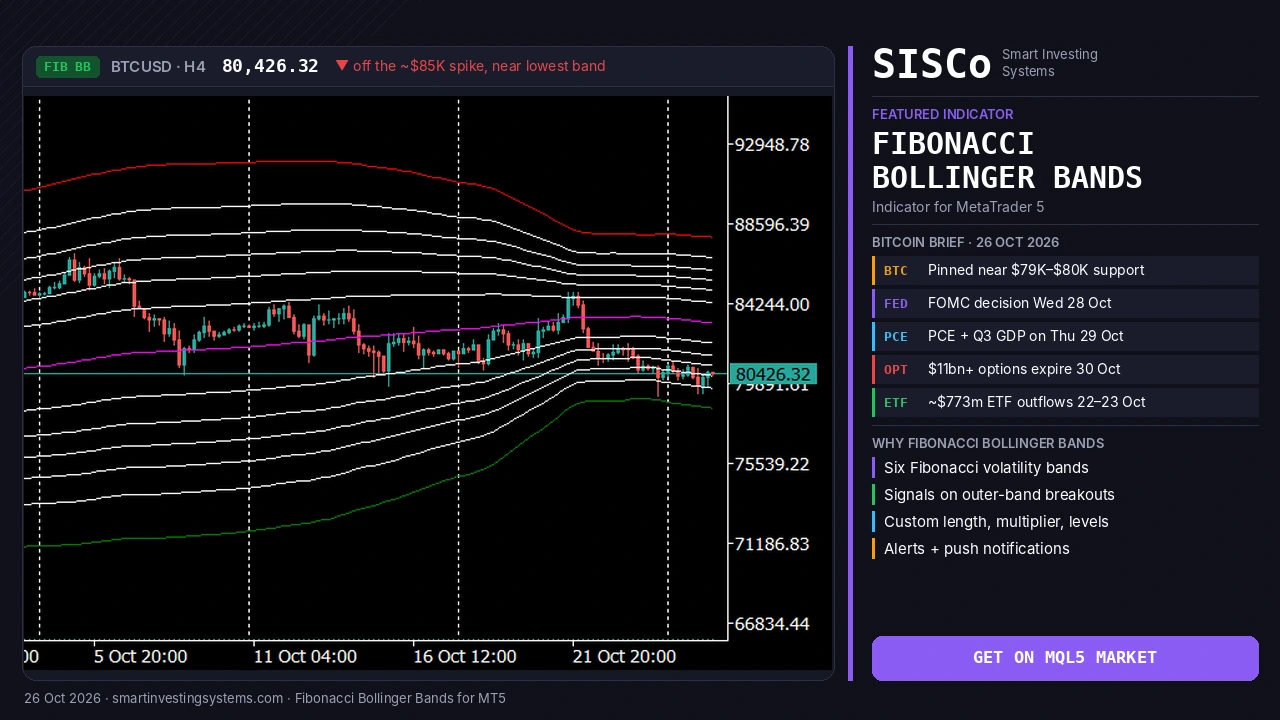
What the BTCUSD H4 chart shows right now: after Bitcoin’s jump in mid-September, price spent most of October between the upper Fibonacci bands and the middle line. The spike toward $85,000 on 21 October reached the upper inner bands and reversed. Since then BTCUSD has drifted down to around $80,400, riding the lower inner bands and sitting just above the lowest band, while the outer bands have narrowed. There is no close below the lowest band yet, so by the indicator’s rules there is no sell signal so far. A close below it would be the first one.
04Step by step: setting up BTCUSD before the Fed
Open BTCUSD on H4 and H1
Use H4 to see the whole range from the $85,000 failure down to the $79,000 area, and H1 to time decisions around the Wednesday and Thursday releases.
Attach the indicator and choose the inputs
Set the Bollinger Bands Length, Price Mode and Band Multiplier. Crypto is more volatile than most forex pairs, so test whether a wider multiplier gives cleaner outer-band signals on your broker’s feed.
Mark the news levels
Draw horizontal lines at $79,000, $80,000, $82,000 and $85,000. Note where each one sits relative to the six bands. Levels that line up with an outer band deserve the most attention.
Turn on alerts
Enable alerts and push notifications for band breakouts. With the FOMC decision due at 2 p.m. ET on Wednesday, you do not want to be staring at the chart for hours waiting.
Wait for a close, not a spike
News candles often wick through both outer bands. Only act on a candle close beyond the band, and check whether price holds there on the following candle.
05Starting settings to test
The product page does not publish recommended values for Bitcoin, so treat the table below as starting points to test in the MT5 Strategy Tester and on a demo account, not as proven settings.
| Use case | Timeframe | Length (starting point) | Multiplier (starting point) | Price mode |
|---|---|---|---|---|
| Pre-event range mapping | H4 | 20 | 3.0 | Close |
| Intraday news reaction | H1 | 20 | 3.0–3.5 | Close |
| Faster scalping view | M15 | 14 | 2.5–3.0 | Close |
| Swing context | D1 | 30 | 3.0 | Close |
Change one input at a time and compare how many outer-band signals each version gives across the last few weeks. Fewer, cleaner signals are usually more useful in an event week than a constant stream of alerts.
06Mistakes to avoid in an event-driven range
Trading the first wick. Fed and PCE releases often produce a spike in both directions. Wait for the candle to close.
Ignoring the expiry. Large options expiries can pull price toward heavily traded strikes into Friday morning and release it afterwards.
Using forex-sized stops. Bitcoin’s bands are wide in dollar terms. Size positions to the distance between bands, not to a fixed number of points.
Relying on one tool. Combine the band signal with clear price levels and, if you like, a volatility-compression tool before committing.
For that last point, the Squeeze Momentum indicator for MT5 is a natural companion: it highlights when volatility has compressed before a release. If you prefer a smoothed envelope instead of standard-deviation bands, compare it with the Nadaraya-Watson Envelope indicator.
07Turning the band rules into an Expert Advisor
Many traders like a band-breakout idea but find it hard to apply consistently during news weeks, when it is tempting to jump in early. One option is to automate the rules: only trade after a candle closes beyond the outer band, skip the candle that contains a scheduled release, and size the position from the band width. An Expert Advisor can follow those rules exactly and can be tested on years of history before it touches a live account.
SISCo has built MetaTrader 4/5 Expert Advisors and indicators since 2017. If you want your own band rules, filters and risk logic coded into an EA, see our custom EA development page or our algorithmic trading services.
Frequently asked questions
What is the difference between Fibonacci Bollinger Bands and normal Bollinger Bands?
Normal Bollinger Bands draw one upper and one lower band. The Fibonacci version draws six bands spaced at Fibonacci ratios of the standard deviation, so you see several graded support and resistance levels around the average.
When does the indicator give a buy or sell signal?
According to the product description, it signals when price breaks above the highest band (buy) or below the lowest band (sell). Touches of the inner bands are reference levels, not signals.
Can I use it on Bitcoin and other crypto CFDs in MT5?
It runs on any symbol and timeframe your MT5 broker offers, including BTCUSD. Because crypto volatility differs from forex and gold, test the length and multiplier on your broker’s data first.
Is there a free demo?
Yes. You can download a free demo from the MQL5 Market and run it in the MetaTrader 5 Strategy Tester before buying.
Map Bitcoin’s range before the Fed decides
Get six Fibonacci volatility bands, breakout alerts and push notifications on your MetaTrader 5 charts, and test the settings on BTCUSD in the Strategy Tester before this week’s events.
Trading involves risk, and crypto CFDs can move sharply around news. This article is for education only and is not financial advice.
Related articles
Heikin Ashi RSI MT5: How to Read HARSI Candles (Gold Guide)
Learn how the Heikin Ashi RSI (HARSI) indicator for MT5 turns RSI into smooth candles, which settings to test, and how to read it…
Read more →
Trend Strength Index MT5: Is Gold’s Rebound Steady Before CPI?
Learn how the Trend Strength Index for MT5 shows how steady gold's rebound is before US CPI, with settings, signals and a step-by-step plan.…
Read more →
Convert MT4 EA to MT5: What OANDA’s MT4 Shutdown Means
Convert MT4 EA to MT5 before brokers like OANDA Japan switch off MT4. Learn what changes in MQL5, how to test it, and get…
Read more →Need a team that can design, build and maintain it all?
Let's talk. Tell us about your project and we'll reply with honest timelines.