HalfTrend Indicator MT5: Reading Gold’s Slide Below $4,000
When gold falls 4% in a week, the hardest part is not spotting that it is falling. It is knowing whether the move is a real trend or just noise you will get whipsawed by. The HalfTrend indicator for MT5 is built for exactly that question: it draws one line that turns blue in uptrends and red in downtrends, and it only changes colour when price moves beyond recent highs or lows by an ATR-based distance. This guide shows how HalfTrend read gold’s slide below $4,000 this week, what each setting does, and a simple routine for using it on XAUUSD and other markets.
Every setting and rule below is a starting point to test on your own broker’s data, not a promise of results.
01What the HalfTrend Indicator Shows
The HalfTrend indicator for MetaTrader 5 uses recent highs and lows, a moving average and ATR to decide trend direction. The result is a single coloured line on your chart:
- Blue line: the indicator reads an uptrend.
- Red line: the indicator reads a downtrend.
- Signals: when the line changes colour, a new trend has started and the indicator marks it.
The key difference from a plain moving average is when it changes its mind. Moving averages cross back and forth in sideways markets. HalfTrend only flips when price pushes beyond recent highs or lows by a distance set with ATR and the Channel Deviation input, which is designed to reduce whipsaws. You get fewer signals, but each one needs a real move behind it.
02Gold This Week: HalfTrend on XAUUSD H1
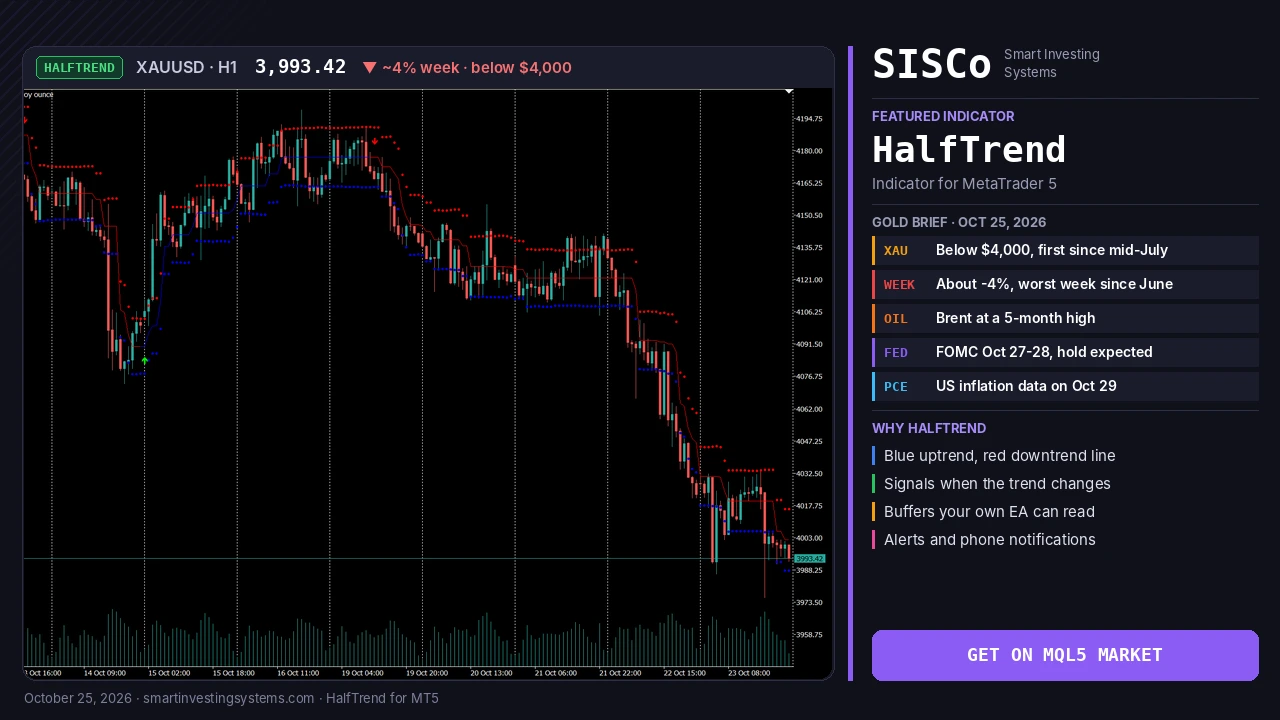
Gold gave a clear live example. On Friday, October 23, 2026, spot gold dropped below $4,000 an ounce for the first time since mid-July, with a session low near $3,975 and a weekly loss of about 4%, its worst week since June, according to Reuters via MINING.COM. Earlier in the day, Reuters reporting carried by Kitco put the low at $3,986.50, the lowest since July 20.
🥇 Below $4,000
First time since mid-July, after a second straight weekly loss.
🛢️ Oil spike
Brent crude hit a more than five-month high after Houthi attacks in Saudi Arabia, adding to inflation worries.
🏦 Fed Oct 27–28
CME FedWatch pricing cited by Reuters showed a hold expected, with a December hike seen as likely.
📊 PCE Oct 29
The Fed’s preferred inflation gauge lands the day after the decision.
Our XAUUSD H1 chart from October 12 to 23 shows how HalfTrend handled the move. It printed buy arrows on October 12 and after the dip to around 4,080 on October 14, and sell arrows near the highs on October 13 and October 19, around the 4,190 area. After the October 19 sell arrow no new buy arrow appeared. The line stepped lower with price through the 4,120 and 4,030 areas to 3,993.42 at the right edge of the chart, while the red dots above price kept moving down with each new lower high.
Notice what HalfTrend did not do: during the sideways chop between roughly 4,110 and 4,140 on October 20 and 21, it did not flip back to a buy. That is the whipsaw filter at work.
03How HalfTrend Decides the Trend
You do not need the formula to use HalfTrend well, but knowing the three ingredients helps you set it up:
Recent highs and lows
The Amplitude input sets how many of the last highs and lows the indicator looks at when deciding the trend.
Moving average
A moving average smooths price so the line does not react to every single candle.
ATR distance
ATR, scaled by Channel Deviation, sets how far price must move before the trend is allowed to change.
Because the distance is based on ATR, it adapts to volatility. In a fast market like gold this week, the required move grows with the candles; in a quiet market it shrinks.
04HalfTrend Settings Explained
The product page lists two main inputs plus groups for the tester dashboard and alerts. The table explains each one. The “starting point” column is a suggestion to test, not a recommended value.
| Setting | What it does | Higher value | Starting point to test |
|---|---|---|---|
| Amplitude | Number of last highs and lows the indicator considers | Looks further back; usually fewer flips | Start with the default, then compare one step higher on volatile H1 gold |
| Channel Deviation | Multiplier that sets the distance of the trend points | Wider channel, signals need bigger moves | Start with the default and only change it after reviewing past signals |
| Tester dashboard | Shows how past signals would have played out on the chart | n/a | Turn on while you evaluate a market and timeframe |
| Alerts and notifications | On-chart alerts or phone notifications on new signals | n/a | Turn on once you are happy with the settings |
Change one input at a time and look back over several weeks of history before deciding. A setting that looks perfect on one week of gold can be too slow or too fast on the next.
05Reading HalfTrend Buy and Sell Signals
The basic reading is simple: trade in the direction of the line colour, and treat a colour change as the start of a new trend. A few extra checks make the signals more useful:
📈 Bullish signal
- The line turns blue on a closed candle
- Price is holding above the line
- Higher timeframe is not in a strong red trend
- Stop goes beyond the recent swing low
📉 Bearish signal
- The line turns red on a closed candle
- Price is holding below the line
- Higher timeframe is not in a strong blue trend
- Stop goes beyond the recent swing high
On gold this week, the October 19 sell signal on H1 lined up with a market that was already making lower highs, which is the kind of agreement worth looking for.
06Step by Step: A HalfTrend Routine for Gold
This routine is a starting framework. Test it on a demo account before using real money.
Set the bias on H4
Attach HalfTrend to an XAUUSD H4 chart. The line colour is your bias: only look for buys when it is blue and sells when it is red.
Time entries on H1
On H1, wait for the line to turn the same colour as the H4 bias on a closed candle. Ignore H1 signals that go against H4.
Place the stop
Put the stop beyond the last swing high or low, not right on the line, so normal gold volatility does not knock you out.
Respect the calendar
With the Fed on October 27–28 and PCE on October 29, consider standing aside or reducing size around those releases, when spreads widen and candles get large.
Exit on the opposite colour
Close or trail the trade when the H1 line flips against you, or use a separate trailing stop such as our Chandelier Exit indicator.
07Common Mistakes and How to Avoid Them
Trading every flip: in a tight range, even a filtered trend line can change colour. Check the higher timeframe first.
Acting before the candle closes: wait for a closed candle so you are trading a confirmed signal.
Ignoring news: big events like the Fed decision can move gold more than any indicator expects.
Over-tuning settings: settings fitted to one week rarely hold. Test over months, not days.
Want a second opinion on trend direction? Compare HalfTrend with our Trend Magic indicator, which builds its line from CCI and ATR. And because HalfTrend provides buffers that an Expert Advisor can read, you can also automate a routine like the one above. If you want that done for you, we can build a custom EA around HalfTrend and your own rules.
Frequently Asked Questions
What does the HalfTrend indicator do?
It uses recent highs and lows, a moving average and ATR to show trend direction: a blue line for uptrends and a red line for downtrends, with signals when the trend changes.
What does the Amplitude setting do?
It sets how many of the last highs and lows the indicator considers when deciding the trend. A larger value looks further back, so test how it changes the number of signals on your market.
Can I use HalfTrend in an Expert Advisor?
Yes. The indicator provides buffers that your own or a custom Expert Advisor can read.
Is there a free demo?
Yes. You can download a free demo from the MQL5 Market and run it in the MetaTrader 5 Strategy Tester before buying.
Try HalfTrend on Your Own Gold Chart
Download the free demo, run it in the Strategy Tester on XAUUSD, and see how its colour changes lined up with this week’s move before you decide. Alerts and phone notifications make sure you do not miss the next signal.
Trading involves risk, and you can lose money. This article is educational and is not financial advice.
Gold · HalfTrend · indicators · mt5 · Trend
Related articles
Heikin Ashi RSI MT5: How to Read HARSI Candles (Gold Guide)
Learn how the Heikin Ashi RSI (HARSI) indicator for MT5 turns RSI into smooth candles, which settings to test, and how to read it…
Read more →
Trend Strength Index MT5: Is Gold’s Rebound Steady Before CPI?
Learn how the Trend Strength Index for MT5 shows how steady gold's rebound is before US CPI, with settings, signals and a step-by-step plan.…
Read more →
Convert MT4 EA to MT5: What OANDA’s MT4 Shutdown Means
Convert MT4 EA to MT5 before brokers like OANDA Japan switch off MT4. Learn what changes in MQL5, how to test it, and get…
Read more →Need a team that can design, build and maintain it all?
Let's talk. Tell us about your project and we'll reply with honest timelines.