Nadaraya-Watson Envelope MT5: A Practical Guide for Gold
Gold just gave traders a textbook lesson in overextension. On Friday, October 23, 2026, spot gold slipped below $4,000 an ounce for the first time since mid-July and was on track for its steepest weekly drop since June. When price runs this far, this fast, the useful question is not “which way is it going?” but “how stretched is it from its own trend?” That is exactly what the Nadaraya-Watson Envelope indicator for MT5 is built to show: a smooth kernel-regression trend line with bands around it that mark when price has pushed too far from that trend.
This guide explains what the Nadaraya-Watson Envelope measures, the repaint question every trader asks about it, what each setting does, and a step-by-step routine for using it on XAUUSD and other markets. Treat every setting and rule below as a starting point to test on your own broker’s data, not as a promise of results.
01Gold This Week: A Live Example of a Stretched Market
The selloff was fast and broad. According to Reuters via Kitco, spot gold touched $3,986.50 on Friday, its lowest level since July 20, and was down about 3.5% on the week at that point, its second weekly loss in a row. Later in the US session, Reuters via MINING.COM reported a session low near $3,975 and a weekly loss of roughly 4%, the worst week since June.
The drivers were macro, not chart patterns. Brent crude hit a more than five-month high after Houthi attacks in Saudi Arabia raised supply worries, and higher energy prices fed fears that inflation could push the Federal Reserve toward a rate hike. CME FedWatch data cited in both reports showed traders expecting the Fed to hold at its October 27–28 meeting, while pricing roughly an 80% chance of a hike by December. The US PCE inflation report follows on October 29.
For a chart reader, that mix creates a familiar problem. After a 4% weekly drop, some traders want to sell the breakdown and others want to buy the bounce. A tool that measures how far price sits from a smoothed trend does not tell you which side is right, but it does tell you when a move has become unusually extended. That is the job of the envelope.
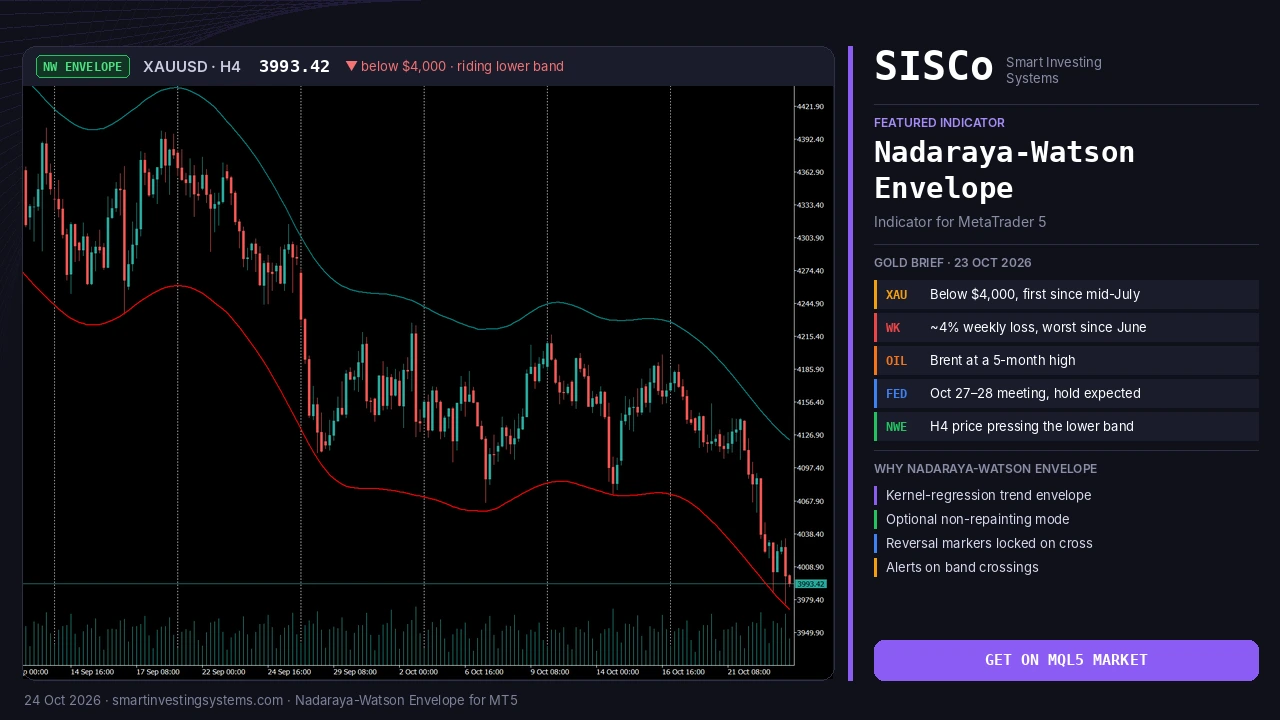
Our XAUUSD H4 chart with the Nadaraya-Watson Envelope shows the move clearly. Both bands have sloped lower since late September, and for most of October gold traded inside them, between roughly 4,070 and 4,215. In the final sessions of the week, price fell from around 4,130 to about 3,993 and pressed against the lower band, while the upper band turned down near 4,125. That is the picture of a market stretched far from its smoothed trend, the zone where the envelope tells you to stop chasing the move and start watching for either a reaction or confirmation that the trend is continuing.
02What the Nadaraya-Watson Envelope Actually Measures
Nadaraya-Watson is a kernel regression method. Instead of averaging the last N prices with fixed weights like a moving average, it weights nearby bars more heavily than distant ones using a smooth kernel, producing a cleaner estimate of the underlying trend. The SISCo indicator then adds an envelope around that estimate. In non-repainting mode, the bands are the trend estimate plus and minus the mean absolute deviation.
A smoothed trend
The centre estimate follows price with less noise than a simple moving average, so you see the “fair” path price has been taking.
Deviation bands
The upper and lower bands show a normal distance from that trend. Closes outside them flag price that has stretched unusually far.
Reversal markers
Triangle markers print when price crosses the bands, and alerts can notify you of each crossing so you do not have to watch the chart.
How does it differ from Bollinger Bands or Keltner Channels? Those are built on moving averages. The envelope uses kernel regression for its trend estimate, which gives a smoother centre line. The product is also explicitly contrarian: the bands are designed to highlight possible reversal zones, not to confirm breakouts. That makes it most at home in ranges and after sharp, emotional moves like gold’s this week.
03The Repaint Question: Which Mode Should You Use?
“Does the Nadaraya-Watson Envelope repaint?” is the most searched question about this indicator, and the honest answer is: you choose. The SISCo version offers two modes through the Repainting Smoothing setting.
Non-repainting mode
Uses an endpoint Nadaraya-Watson estimator. Historical bands stay where they were drawn, so what you see on old bars matches what you would have seen in real time. Use this mode for trading decisions and for any backtesting.
Repainting mode
Uses a real-time estimator that updates continuously. The envelope looks smoother, but its history shifts as new bars arrive. Use it for visual analysis only.
One detail matters here: according to the product description, the triangle reversal markers appear at the moment a cross happens and stay locked in place, even in repainting mode. Still, if you are judging past signals by eye, use non-repainting mode, because a band that redraws can make old crosses look cleaner than they really were.
Many free Nadaraya-Watson scripts online repaint by default, which makes their history look almost perfect. Always check which mode you are looking at before trusting a screenshot, including your own.
04The Settings, Explained
The indicator has four main inputs. The table explains what each one does and which direction to adjust it. The suggestions are starting points to test, not recommended values.
| Setting | What it controls | Starting point to test |
|---|---|---|
| Bandwidth | Smoothness of the envelope. Higher values give smoother, slower bands. | Keep the default first; raise it on noisy lower timeframes like M5–M15, lower it if bands lag too much on H4–D1. |
| Mult | Envelope width, meaning how far the bands sit from the trend. | Widen it in very volatile markets such as gold this week so only true extremes touch the bands; narrow it in quiet ranges. |
| Source | The price series used, such as close, open or hl2. | Close for signals based on bar closes; hl2 if you want the trend to account for wicks. |
| Repainting Smoothing | Switches between repainting and non-repainting estimators. | Non-repainting for trading and testing; repainting only for chart reading. |
Change one setting at a time and compare results in the MetaTrader 5 Strategy Tester. If you change Bandwidth and Mult together, you will not know which change helped.
05Step-by-Step: Using the Envelope on XAUUSD
Here is a simple routine that keeps the envelope in its proper role: a filter for stretched prices, not a stand-alone entry button.
Pick your timeframe
Choose the chart you actually trade. H1 and H4 are good starting points for gold swing trades; lower timeframes produce more crossings and more noise.
Switch to non-repainting mode
Set Repainting Smoothing to the non-repainting option so every band and marker you study is historically honest.
Check the market regime
Is price ranging or trending hard? The envelope works best in ranges and after spikes. In a strong trend, price can ride one band for a long time.
Wait for a close beyond a band
A close outside the lower band marks a stretched downside move; a close above the upper band marks a stretched upside move. A wick alone is weaker evidence.
Ask for confirmation
Look for momentum turning, for example with the Impulse MACD indicator for MT5, or a reaction at a known level from the Support and Resistance Levels indicator.
Plan risk before entry
Put the stop beyond the recent extreme, aim first for the centre trend line, and avoid entering right before scheduled events such as the Fed decision or the PCE release.
06Reading the Signals
Because the tool is contrarian, its “buy” and “sell” ideas are about stretched prices snapping back toward the trend. Here is how to read each side.
📈 Bullish signal
- Price closes below the lower band, then a triangle marker prints on the cross back
- Momentum stops making new lows
- Price is near a support level, such as a round number like $4,000 in gold
- First target: the centre trend estimate
📉 Bearish signal
- Price closes above the upper band, then a triangle marker prints on the cross back
- Momentum stops making new highs
- Price is near a resistance level or a prior swing high
- First target: the centre trend estimate
The centre line is useful on its own too. When price keeps returning to it and bouncing, the market is trending; when price swings from band to band through it, the market is ranging and the envelope’s contrarian signals tend to be more meaningful.
Do not buy a lower-band touch in a market that is falling for a fundamental reason without other confirmation. Gold’s drop this week was driven by oil and rate expectations, and those can keep pressure on for longer than a chart suggests.
If you want to measure the panic itself, our guide to the Williams Vix Fix on gold shows how to spot fear spikes alongside the envelope.
07Common Mistakes to Avoid
Trusting repainted history
Judging the indicator by how good the repainting history looks. Test in non-repainting mode only.
Fading strong trends
Selling every upper-band close in a powerful rally. In trends, use the bands to time pullbacks in the trend direction instead.
Over-tuning settings
Tweaking Bandwidth and Mult until past trades look perfect. Settings that fit one month of gold rarely fit the next.
Ignoring the calendar
Entering a mean-reversion trade minutes before a Fed decision or a major data release, when volatility can blow through any band.
08Frequently Asked Questions
Does the Nadaraya-Watson Envelope for MT5 repaint?
It depends on the mode you choose. Non-repainting mode keeps historical bands stable. Repainting mode gives smoother bands but its history changes as new bars arrive. The triangle markers are designed to stay where they printed.
Is the Nadaraya-Watson Envelope a trend-following indicator?
No. It is contrarian. It highlights possible reversal zones when price extends too far from its smoothed trend, so it suits ranging markets and sharp spikes better than strong trends.
How is it different from Bollinger Bands?
Bollinger Bands use a moving average and standard deviation. This envelope uses a Nadaraya-Watson kernel regression trend and, in non-repainting mode, the mean absolute deviation for its bands.
Can I try it before buying?
Yes. A free demo is available on the MQL5 Market, and you can run it in the MetaTrader 5 Strategy Tester first.
Add the Nadaraya-Watson Envelope to Your MT5 Charts
Get the kernel-regression envelope with a non-repainting mode, locked reversal markers and alerts, and test it on gold or any symbol in your Strategy Tester. Want the envelope logic inside a fully automated system with your own rules and risk management? Request a custom Expert Advisor or explore our algorithmic trading development services.
Trading involves risk, and you can lose money. This article is for education only and is not financial advice.
Gold · Mean Reversion · mt5 · Nadaraya-Watson Envelope · Volatility
Related articles
Heikin Ashi RSI MT5: How to Read HARSI Candles (Gold Guide)
Learn how the Heikin Ashi RSI (HARSI) indicator for MT5 turns RSI into smooth candles, which settings to test, and how to read it…
Read more →
Trend Strength Index MT5: Is Gold’s Rebound Steady Before CPI?
Learn how the Trend Strength Index for MT5 shows how steady gold's rebound is before US CPI, with settings, signals and a step-by-step plan.…
Read more →
Convert MT4 EA to MT5: What OANDA’s MT4 Shutdown Means
Convert MT4 EA to MT5 before brokers like OANDA Japan switch off MT4. Learn what changes in MQL5, how to test it, and get…
Read more →Need a team that can design, build and maintain it all?
Let's talk. Tell us about your project and we'll reply with honest timelines.