Williams Vix Fix MT5: Spotting Gold’s Fear Spike Near $4,000
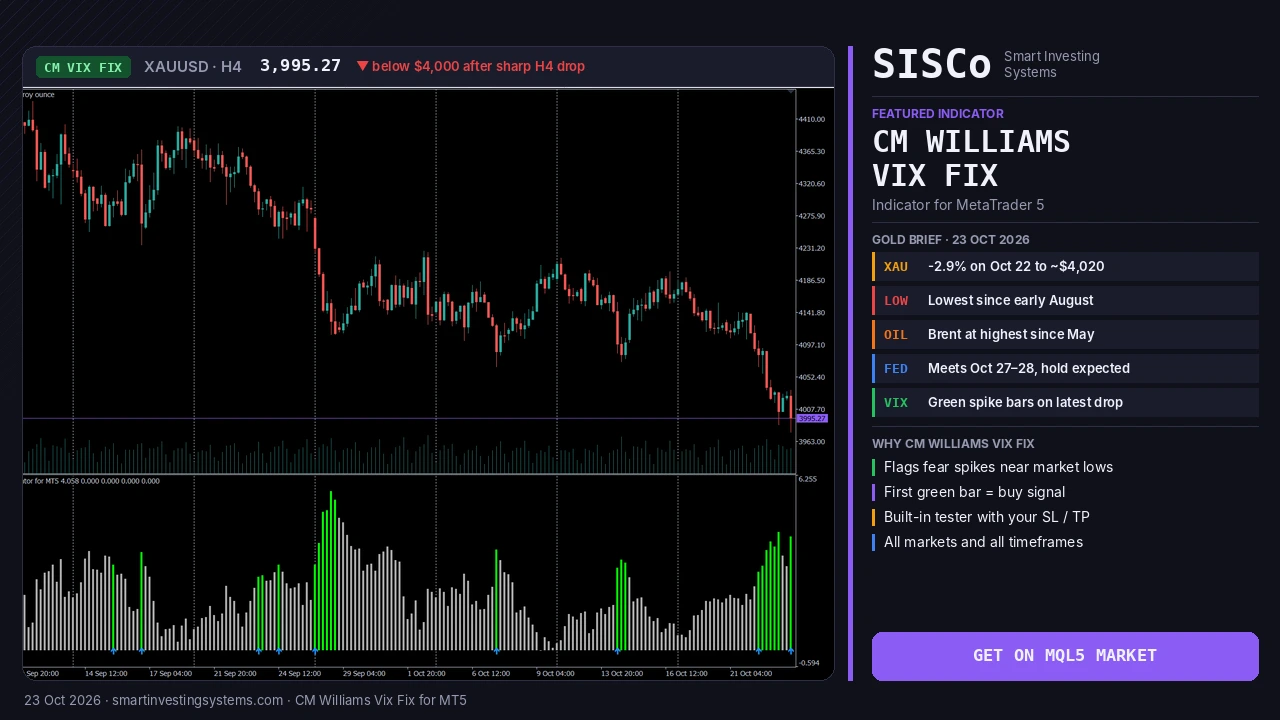
Gold just had its worst day in weeks. On Thursday, October 22, 2026, spot gold fell almost 3% to around $4,020 an ounce, its lowest level since early August, as an oil spike and hawkish Fed expectations pushed traders to sell. When a market drops this fast, the hard question is not “is it falling?” but “is the fear overdone yet?” The Williams Vix Fix was built to answer exactly that, and the CM Williams Vix Fix indicator for MT5 puts it on your MetaTrader 5 chart with a clear rule for spotting buy-the-dip setups.
This guide explains what happened in gold this week, what the Williams Vix Fix measures, how to read its gray and green bars, and a practical routine for using it on XAUUSD without trying to catch every falling knife. Every setting and rule below is a starting point to test on your own broker’s data, not a promise of results.
01What Happened to Gold This Week
The selloff came in one sharp leg. According to the investingLive Americas wrap, gold closed the US session on October 22 at about $4,021.61, down $119 or 2.88%, while silver fell nearly 6%. Reuters, via Kitco, described it as gold’s lowest level since August 4.
The drivers are the same ones gold traders have watched all month, only louder:
Gold: down about 2.9% on Oct 22 to roughly $4,020/oz, a more than two-month low.
Oil: Brent hit its highest level since May after new Houthi attacks in Saudi Arabia, reviving inflation fears.
Fed: meets October 27–28 and is expected to hold, but CME FedWatch pricing shows a December hike as the likely next move.
Data: US initial jobless claims came in at 194K versus 200K expected, another sign the labour market is not cracking.
Higher rates for longer hurt gold because it pays no yield. Trading Economics also noted that a selloff in tech and AI stocks pushed some traders to sell precious metals to cover losses elsewhere. That kind of forced, liquidity-driven selling is exactly the environment where a “fear gauge” for a single market becomes useful: price can overshoot, and the question becomes when panic is peaking.
02What the Williams Vix Fix Actually Measures
The CBOE VIX measures expected volatility in the S&P 500, and it tends to spike when stocks fall hard. The problem is that there is no VIX for every market. Trader Larry Williams created the “Vix Fix” to recreate that behaviour from price alone, so you can build a fear gauge for gold, a forex pair, an index or a crypto coin.
The core idea is simple. The indicator asks: how far is today’s low below the highest close of the recent lookback period? When price collapses away from its recent high, that distance grows, and the Vix Fix histogram spikes. In Larry Williams’ original formula this is calculated as the highest close of the lookback minus the current low, divided by that highest close, times 100.
The CM version that became popular on TradingView adds a second layer: it wraps the raw value in Bollinger Band style statistics, so a spike is only highlighted when it is unusually large compared with recent history. As the SISCo product page explains, the MT5 indicator combines Bollinger Band and momentum calculations to flag these fear spikes.
Low readings
Price is close to its recent highs. Little fear, no setup.
Rising readings
Price is falling away from its highs. Fear is building, but the drop may not be done.
Extreme spike
The drop is unusually large versus recent history. This is the capitulation-style zone the indicator is designed to find.
03How to Read the Gray and Green Bars in MT5
The SISCo CM Williams Vix Fix for MT5 keeps the signal logic simple. The product page describes it like this: after the gray bars appear, you will see green bars, and the first green bar is the buy signal.
In practice, think of it as a two-stage read:
- Gray bars mark the fear-spike phase, when selling pressure is extreme relative to recent history. This is the warning that a low may be forming, not an instruction to buy.
- The first green bar after that phase is the signal. It suggests the spike condition has changed, which is your cue to look for an entry, ideally confirmed by price action.
One important design point: the Williams Vix Fix is a buy-signal tool only. Unlike oscillators such as RSI that flag both overbought and oversold conditions, it is designed to find capitulation-style lows. It does not give sell signals, so you need a separate method for exits and short trades.
📈 Bullish signal
- A run of gray bars during a sharp drop
- The first green bar prints after the gray phase
- Price holds or reclaims a nearby support level
- Your higher-timeframe trend is still up or neutral
📉 Bearish context (no trade)
- No gray-bar spike: the drop is still “normal”
- Price keeps closing below support after the green bar
- A major event (such as the Fed decision) is hours away
- The higher-timeframe structure has turned down
04Applying It to Gold Right Now
This week’s gold move is a textbook case of the condition the Vix Fix looks for: a fast, one-sided drop of almost 3% in a day, driven by macro fear and forced selling rather than a slow grind lower. On an H1 or H4 XAUUSD chart, a drop like that is the kind of move that tends to push the Vix Fix into its highlighted zone.
But context matters. The macro story has not gone away: oil remains elevated and the Fed meets on October 27–28, with US PCE inflation data due on October 29. FXStreet noted that Societe Generale sees the June low near $3,960/3,940 as the next support if current levels break. That means a green bar this week is a reason to watch closely, not a reason to buy blindly ahead of a central bank decision.
A practical way to use it in this environment is to combine the Vix Fix signal with clear levels. The Support and Resistance Levels indicator for MT5 can mark the zones buyers have defended, and the Market Structure CHoCH BOS indicator can show when the short-term structure actually shifts back up. A green bar that lines up with a defended level and a bullish change of character is a much stronger read than a green bar on its own.
The XAUUSD H4 chart in the banner above shows this in practice. Gold has drifted lower from around 4,430 in early September to 3,995, with a series of lower highs along the way. The CM Williams Vix Fix printed clusters of green spike bars, each marked with an arrow at the first green bar, on the sharp late-September drop and on the mid-October dips. A new cluster is forming on this week’s slide below $4,000, while price is still making fresh lows, so that is the moment to wait for confirmation rather than rush in.
05Step-by-Step: A Buy-the-Dip Routine for XAUUSD
Here is a simple, rules-based routine you can test in the MT5 Strategy Tester or on a demo account before using it live.
Set the higher-timeframe bias
Open a D1 gold chart and decide whether the bigger trend is up, down or sideways. Dip-buying signals work best when you are buying a pullback inside an uptrend or a range, not fighting a clear downtrend.
Attach the Vix Fix to your trading timeframe
Add the CM Williams Vix Fix to an H1 or H4 XAUUSD chart. The indicator works on all markets and timeframes, so you can repeat the same routine on other symbols.
Wait for the gray phase
Do nothing while the histogram is printing gray bars. This is the panic phase, and price can keep falling while it lasts.
Confirm the first green bar
When the first green bar appears, check that price is holding a support zone or has printed a bullish candle. Only then plan an entry.
Define risk before you click
Place the stop below the spike low and size the position so a stop-out is a small loss. Plan your exit separately, for example with a trailing stop, because the Vix Fix does not give sell signals.
The SISCo version also includes a built-in tester panel, which lets you see how past signals behaved over a chosen period using your own stop loss and take profit levels. Past signals do not guarantee future results.
06Vix Fix vs Other Oversold Tools
Each tool answers a slightly different question. The table below is a general comparison to help you choose what to test, not a ranking.
| Tool | What it measures | Signal direction | Best used for |
|---|---|---|---|
| CM Williams Vix Fix | How far price has dropped from recent highs, compared with its own history | Buy signals only | Spotting fear spikes and capitulation-style lows |
| RSI | Speed and size of recent gains versus losses | Overbought and oversold | General momentum and divergence reads |
| Bollinger Bands | Price distance from a moving average in standard deviations | Both directions | Volatility expansion and mean-reversion zones |
| Support and resistance levels | Prices where buyers or sellers stepped in before | Both directions | Choosing where to enter and place stops |
Starting point to test: many traders pair the Vix Fix on H1 or H4 with D1 support levels for gold, and require at least one bullish candle close after the first green bar. Test both with and without that confirmation on your broker’s data to see which fits your style.
07Common Mistakes to Avoid
Buying during the gray bars. Gray bars mean fear is extreme, not that it is finished. Waiting for the first green bar is the whole point of the indicator’s rule.
Ignoring the calendar. With a Fed decision on October 28 and PCE data on October 29, gold can gap through levels. Reduce size or wait around major releases.
A third mistake is using the Vix Fix as a complete system. It is a timing tool for entries. If you want a full rules-based strategy that combines a Vix Fix entry with your own filters, stops and position sizing, SISCo can build it for you as a custom Expert Advisor for MT5.
Frequently Asked Questions
What is the Williams Vix Fix indicator?
It is an indicator created by Larry Williams that recreates the behaviour of the VIX “fear index” using price data. It measures how far price has fallen from its recent highs, so it can be applied to gold, forex, indices or crypto, which have no VIX of their own.
Does the CM Williams Vix Fix give sell signals?
No. It is designed specifically to provide buy signals. Use a separate tool, such as a trailing stop or a structure indicator, to manage exits and short trades.
How do I read the signal in MT5?
After gray bars appear, the first green bar is the buy signal. Combine it with your own trend filter or support level before entering.
Can I test it before buying?
Yes. You can download a free demo from the MQL5 Market and run it in the MetaTrader 5 Strategy Tester, and the indicator’s built-in tester lets you check past signals with your own stop loss and take profit.
Spot the Fear Spike Before You Buy the Dip
Gold’s drop toward $4,000 is a reminder that the best dip-buying chances come when fear is at its peak. Add the CM Williams Vix Fix for MT5 to your XAUUSD chart, wait for the first green bar, and confirm it with your own levels before you commit.
Trading involves risk. This article is for educational purposes only and is not financial advice.
Buy the Dip · Gold · mt5 · Volatility · Williams Vix Fix
Related articles
Heikin Ashi RSI MT5: How to Read HARSI Candles (Gold Guide)
Learn how the Heikin Ashi RSI (HARSI) indicator for MT5 turns RSI into smooth candles, which settings to test, and how to read it…
Read more →
Trend Strength Index MT5: Is Gold’s Rebound Steady Before CPI?
Learn how the Trend Strength Index for MT5 shows how steady gold's rebound is before US CPI, with settings, signals and a step-by-step plan.…
Read more →
Convert MT4 EA to MT5: What OANDA’s MT4 Shutdown Means
Convert MT4 EA to MT5 before brokers like OANDA Japan switch off MT4. Learn what changes in MQL5, how to test it, and get…
Read more →Need a team that can design, build and maintain it all?
Let's talk. Tell us about your project and we'll reply with honest timelines.