Chandelier Exit Indicator MT5: How to Trail Stops on Gold
Gold dropped about 1% on Thursday after four straight losing sessions, as an oil rally keeps “higher for longer” rate fears alive ahead of the Fed’s October 27–28 meeting. When volatility shifts this quickly, a fixed-distance stop is either too tight or too loose most of the time. The Chandelier Exit indicator solves that by placing your trailing stop a set number of ATRs away from the recent extreme, so the stop breathes when volatility expands and tightens when it calms down.
This guide explains what the Chandelier Exit measures, how the Chandelier Exit Indicator for MT5 turns it into clear buy and sell signals, and a practical step-by-step routine for trailing a gold trade with it. Every setting below is a starting point to test on your own broker’s data, not a promise of results.
01Why Gold Traders Are Rethinking Their Stops This Week
On Thursday, October 22, 2026, spot gold traded near $4,084 an ounce in European hours, down about 1.0% on the day, after falling for a fourth straight session on Wednesday, according to FXEmpire. CNBC reported the same move as gold dropping over 1% as the oil rally reinforced a higher-for-longer rate outlook.
The driver is the same one traders have watched all month: higher crude prices keep inflation worries alive, and that keeps the Federal Reserve leaning hawkish. Nearly all economists in a Reuters poll expect the Fed to hold at the October 27–28 meeting and hike in December. Analysts are watching the $4,068–$4,079 zone, which buyers have defended twice this month.
Gold: near $4,084/oz on Oct 22, down about 1% on the day.
Oil: the rally in crude is feeding inflation and rate-hike worries.
Fed: meets October 27–28; a hold is expected, with a December hike widely anticipated.
Levels: analysts flag $4,068–$4,079 as key support.
When a market trends lower for days and then faces a scheduled catalyst, two things happen to stop-losses. Short sellers who are in profit need a way to lock gains without getting shaken out by a sharp bounce. Buyers looking for a turn need a stop that respects the current size of the swings. Both are exactly the job a volatility-based trailing stop is designed for.
02What the Chandelier Exit Actually Measures
The Chandelier Exit was developed by Chuck Le Beau and popularised by Alexander Elder. The idea is simple: hang the stop from the highest point of the trend, like a chandelier hangs from the ceiling, and keep it a volatility-adjusted distance below that high. As described by the Corporate Finance Institute, the two lines are:
- Long exit: highest high of the last N bars minus (ATR of N bars × multiplier)
- Short exit: lowest low of the last N bars plus (ATR of N bars × multiplier)
ATR, the Average True Range, is the average size of each bar including gaps. When gold gets busy, ATR rises and the stop moves further from price. When gold goes quiet, ATR falls and the stop moves closer. The commonly published starting point is a 22-bar lookback with a multiplier of 3.
A quick illustration with round, hypothetical numbers: if the highest high of the last 22 H1 bars is $4,150 and ATR is $12, the long stop sits at 4,150 − (12 × 3) = $4,114. If price makes a new high at $4,170 and ATR stays the same, the stop climbs to $4,134. It never needs you to guess a pip value.
03How the SISCo Chandelier Exit Indicator Works in MT5
The Chandelier Exit Indicator for MT5 is a trend-following, volatility-based tool that plots an ATR band with buy and sell arrows. When price crosses the ATR band, the indicator generates a buy or sell signal, which makes trend flips easy to see on any chart. It works on all timeframes and markets, including forex, crypto, stocks and commodities such as gold.
ATR Length
The lookback period used for the Average True Range calculation.
ATR Multiplier
Controls how far the band sits from price. Higher means more room, fewer flips.
Use Close Price for Extremums
Uses closing prices instead of highs and lows to find the extremes, refining signals with close-price precision.
Alerts and Tester Settings
Notifications on every signal, plus tester settings for backtesting and optimisation.
Here is how to read the two signal types on a gold chart:
📈 Bullish signal
- Price closes back above the short-side ATR band
- A buy arrow prints and the band flips below price
- The band then acts as your trailing stop for the long
📉 Bearish signal
- Price closes below the long-side ATR band
- A sell arrow prints and the band flips above price
- The band then trails above price as the short’s stop
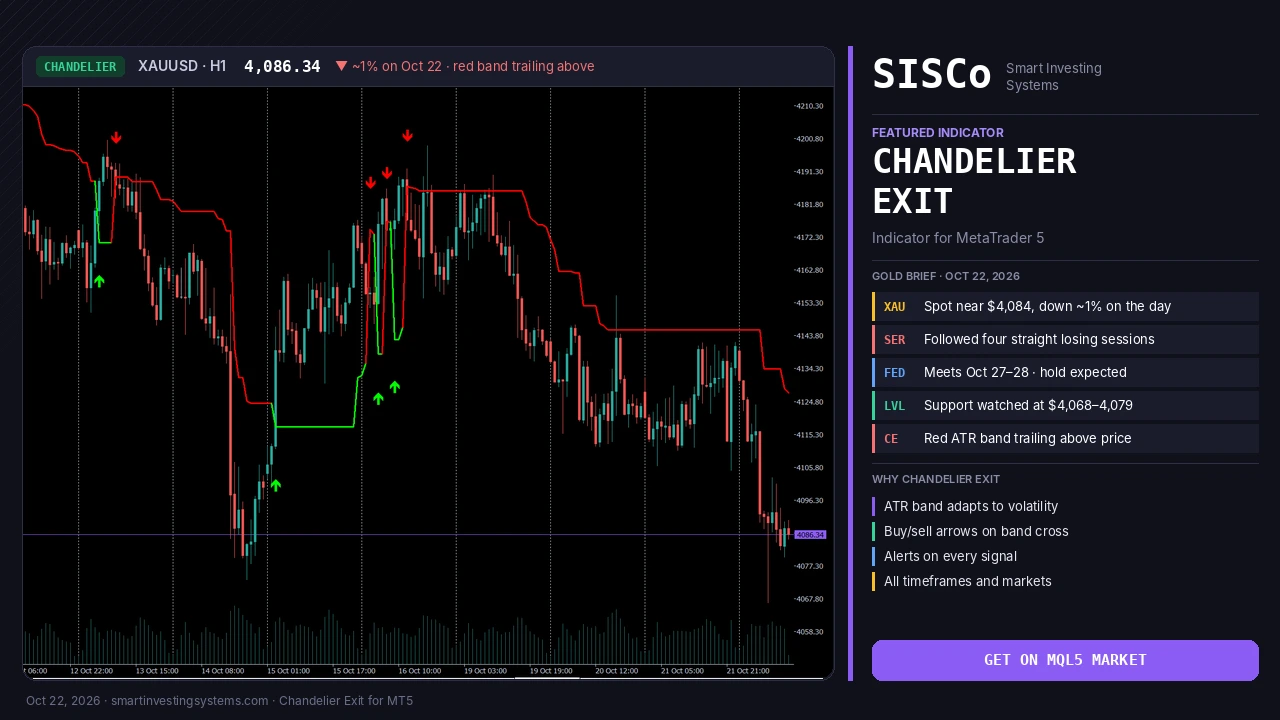
The chart at the top of this article shows the indicator on gold’s H1 chart from October 12 to 22. The band flipped green after the October 14 low near $4,080, which caught the rebound, and then turned red again after a sell arrow printed near the October 16 peak around $4,190. Since then the red band has stepped down above price, from roughly $4,185 to $4,145 and most recently to about $4,127, while gold slid to around $4,086. For a short trade, that is exactly how the trailing stop is meant to behave: it only moves in the trade’s favour, and it keeps its distance as volatility allows.
04Step-by-Step: Trailing a Gold Trade with the Chandelier Exit
The routine below is the same whether you trade gold, a major forex pair or an index. It treats the Chandelier Exit as a stop-management tool first and a signal tool second.
Pick your trading timeframe
Attach the indicator to XAUUSD on the timeframe you actually trade. H1 suits swing-intraday traders; H4 suits those holding through events like the Fed meeting.
Start from the classic settings
Begin with ATR Length 22 and Multiplier 3, then adjust only after you have watched how the band behaves around recent swings.
Confirm direction with the arrow
Only take longs after a buy arrow and shorts after a sell arrow, or use the arrow to confirm a setup you found with support and resistance.
Place the stop on the band
Put your initial stop just beyond the band, allowing a little extra for your broker’s spread, and size the position so that distance equals your planned risk.
Trail at each bar close
After every closed bar, move your stop to the new band value, only in the direction of the trade. Exit when price closes through the band or the opposite arrow prints.
Two practical notes for this week. First, around high-impact events such as the Fed decision or the PCE release, gold can wick through any stop in seconds; many traders reduce size rather than widen the multiplier. Second, combine the band with clear horizontal levels. Our Support and Resistance Levels Indicator for MT5 marks those zones automatically, so you can see when the trailing stop sits just above or below a level the market is likely to defend.
05Chandelier Exit Settings by Timeframe
There is no single best setting. The table gives starting points to test on your own data; your broker’s spreads, session hours and your risk tolerance should decide the final values.
| Trading style | Timeframe | ATR Length (start) | Multiplier (start) | Close for extremums |
|---|---|---|---|---|
| Active intraday | M15 | 14 | 2.0–2.5 | On, to reduce wick noise |
| Swing-intraday | H1 | 22 | 3.0 | Test both |
| Event / multi-day swing | H4 | 22 | 3.0–3.5 | Off, to respect true extremes |
| Position | D1 | 22 | 3.0 | Off |
A lower multiplier keeps you closer to price and locks profit sooner, but produces more flips in choppy conditions. A higher multiplier gives the trade room to survive pullbacks but gives back more at the end of a move. Use the indicator’s tester settings to compare a few combinations over the last several months of gold before committing to one.
06Common Mistakes with ATR Trailing Stops
Moving the stop backwards
A trailing stop only ever moves in your favour. Widening it after the fact turns a plan into hope.
Ignoring the spread
Gold spreads widen around news. Leave a small buffer beyond the band so normal spread spikes do not take you out.
Trading every flip in a range
When gold chops sideways, the band can flip repeatedly. Filter signals with higher-timeframe trend or clear levels.
Over-optimising settings
Settings that look perfect on one month of data often fail on the next. Prefer round, robust values that work across periods.
The Chandelier Exit tells you where a trend would be considered broken; it does not predict where price goes next. Always decide your risk per trade before you look at the signal.
07Automating the Chandelier Exit in an Expert Advisor
Trailing a stop by hand at every bar close is easy to forget, especially when gold is moving fast overnight. The logic is a good fit for automation: read the band value on each new bar, move the stop only in the trade’s favour, and close when price crosses through. If you would like your own rules built into a reliable MT5 Expert Advisor, with your entries, position sizing and this kind of ATR trailing stop, our team can build a custom EA for you. SISCo has delivered more than 1,549 trading systems since 2017, with lifetime bug-fix support. You can also explore our algorithmic trading development services.
If you prefer a different style of volatility stop, the MOST – Moving Stop Loss Indicator for MT5 is another option in our range worth comparing side by side.
Frequently Asked Questions
What is the best Chandelier Exit setting for gold?
The widely published starting point is a 22-bar ATR with a multiplier of 3. On lower timeframes many traders test shorter lengths and smaller multipliers. Treat any value as a starting point and test it on your broker’s XAUUSD data.
Is the Chandelier Exit an entry or an exit indicator?
It was designed as an exit, but because the SISCo version prints buy and sell arrows when price crosses the ATR band, many traders also use those flips to confirm entries in the direction of the trend.
Does the Chandelier Exit work on forex pairs and crypto?
Yes. Because it is based on ATR, it adapts to each instrument’s own volatility, and the indicator works on all timeframes and markets, including forex, crypto, stocks and commodities.
Can I get alerts when the signal changes?
Yes. The indicator includes alert settings that notify you on every signal, so you do not need to watch the chart all day.
Let Volatility Set Your Stop, Not Guesswork
Add the Chandelier Exit Indicator for MT5 to your gold chart, start from the classic 22 / 3 settings, and trail every trade with a stop that adapts to the market you are actually trading.
Trading involves risk. This article is for educational purposes only and is not financial advice.
Chandelier Exit · Gold · mt5 · Trailing Stop · Volatility
Related articles
Squeeze Momentum Indicator MT5: Gold’s Pre-Fed Breakout Setup
Gold fell four sessions in a row before the Oct 27–28 Fed. See how the Squeeze Momentum indicator for MT5 spots the coil before…
Read more →
The Week That Changed Everything — How RMI Trend Sniper Would Have Caught Every Major Move
A historic forex week: FOMC split, Japan's ¥5.4T intervention and gold above $5,000. See how the RMI Trend Sniper MT5 indicator tracked every move.
Read more →
WTI Crude at $106: How to Trade the Hormuz Supply Shock with a Dedicated MT5 Indicator
WTI trades at $106 as the Strait of Hormuz stays blocked. How to trade the oil supply shock on MT5 with a dedicated crude…
Read more →Need a team that can design, build and maintain it all?
Let's talk. Tell us about your project and we'll reply with honest timelines.