Squeeze Momentum Indicator MT5: Gold’s Pre-Fed Breakout Setup
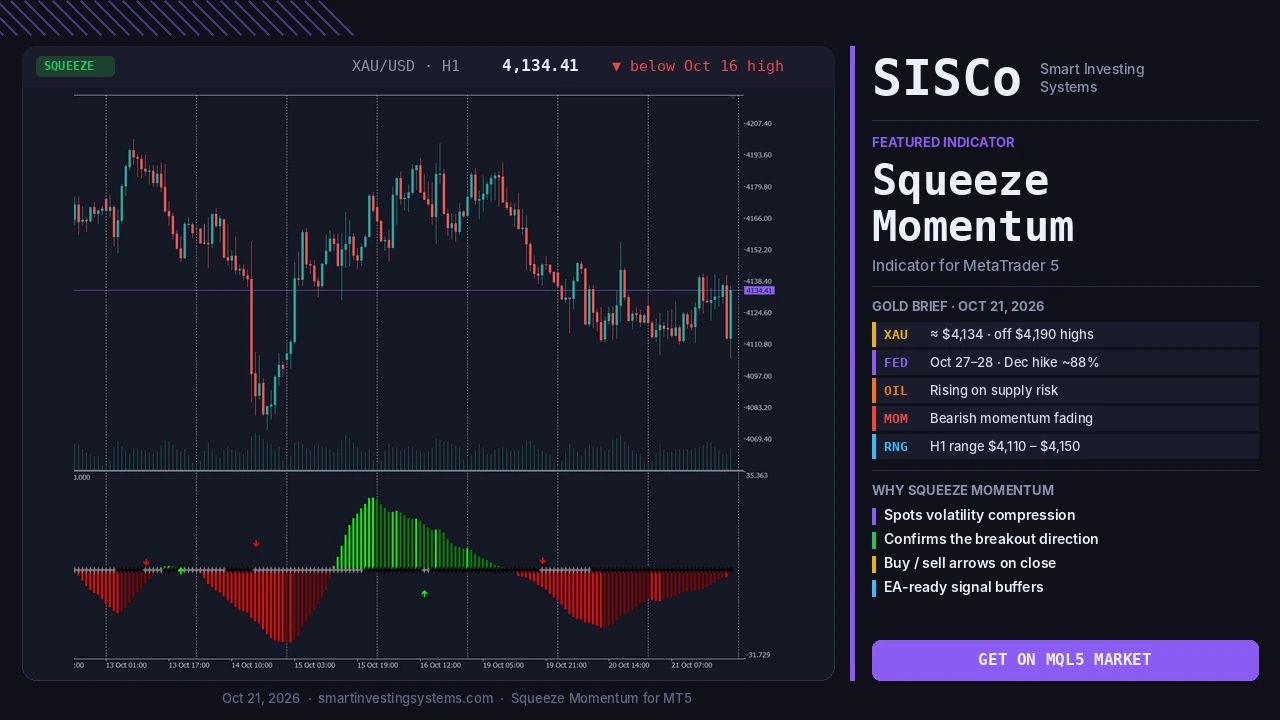
Gold has slipped for four sessions in a row, oil is pushing inflation worries higher, and the Federal Reserve meets on October 27–28. Markets that are waiting for a big decision tend to go quiet first and move hard later. The Squeeze Momentum indicator for MT5 is built for exactly that moment: it shows you when volatility is being compressed, and which way momentum points when the pressure is released.
This guide walks through what is happening in gold this week, why pre-Fed markets so often coil before they break, and a practical step-by-step plan for using the Squeeze Momentum Indicator for MT5 to prepare for the move instead of chasing it.
01What Is Happening in Gold This Week
On Wednesday, October 21, 2026, spot gold traded around $4,119 an ounce, down 0.1% in early European hours and lower for a fourth straight session, according to a Reuters report carried by Business Recorder. US gold futures for December delivery were near $4,137.
The pressure is coming from oil. Rising crude prices on Middle East supply concerns are keeping inflation fears alive, and that is feeding expectations of a more hawkish Federal Reserve. Nearly all economists in a Reuters poll expect the Fed to hold at the October 27–28 meeting and hike in December, and CME FedWatch was pricing roughly an 88% chance of a December hike. Silver also fell, to about $57.35 an ounce, and the USAGOLD daily report described physical gold holding near the $4,120 area.
Gold: about $4,119/oz, four sessions lower in a row.
Oil: rising on Middle East supply risk, lifting inflation concerns.
Fed: meets October 27–28; a hold is expected, with a December hike widely priced.
Next catalyst: US PCE inflation data is due next week.
The H1 chart at the top of this article shows the setup clearly. Gold dropped sharply toward $4,083 on October 14, rebounded to around $4,190 by October 16, and has slipped back since. The Squeeze Momentum histogram turned negative around October 19 and a sell arrow printed, but look at the latest bars: they have turned darker and are shrinking toward zero while price compresses between roughly $4,110 and $4,150. Bearish momentum is fading, and the market is coiling.
None of this tells you where gold goes next. What it does tell you is that the market has a clear, scheduled catalyst ahead, and that is the kind of environment where volatility often contracts before it expands.
02Why Markets Coil Before a Big Decision
Ahead of a central bank decision, many large participants reduce position size and wait. Fewer aggressive orders means smaller candles, tighter ranges and falling volatility. Price drifts, but without conviction. Then the decision lands, positions are rebuilt at once, and volatility expands quickly in one direction.
Traders who only watch price often get caught in two ways during this cycle. They enter breakouts inside the quiet range that go nowhere, or they miss the real expansion because it starts faster than they can react. A volatility-compression tool solves both problems: it tells you to stay patient while the range is tightening, and it flags the moment the compression ends.
03How the Squeeze Momentum Indicator Works
The Squeeze Momentum indicator combines two classic volatility envelopes, Bollinger Bands and Keltner Channels, with a momentum histogram. When the Bollinger Bands contract inside the Keltner Channels, volatility is unusually low: that is the “squeeze”. When the bands expand back outside the channels, the squeeze has released and a directional move may be starting.
Squeeze detection
Marks low-volatility periods when the Bollinger Bands sit inside the Keltner Channels, so you can see the coil forming.
Momentum histogram
Shows the strength and direction of momentum, changing colour as momentum builds or fades.
Buy and sell signals
Arrows appear when a squeeze releases and momentum confirms the direction, and every buffer is available to an Expert Advisor.
The indicator also includes an integrated tester panel, so you can check how a setting would have behaved in the MT5 Strategy Tester, using a start date plus take-profit and stop-loss values in points, before you rely on it.
04Reading a Bullish or Bearish Squeeze Release
A squeeze on its own is not a signal. It is a warning that a move is building. The trade idea comes from the release combined with momentum direction:
📈 Bullish release
- The squeeze condition ends as the Bollinger Bands expand back outside the Keltner Channels
- The momentum histogram is above zero and strengthening
- A buy arrow prints on candle close
- Price is holding above a nearby support level, not running into resistance
📉 Bearish release
- The squeeze condition ends as volatility expands
- The momentum histogram is below zero and strengthening downward
- A sell arrow prints on candle close
- Price is breaking away from support rather than bouncing from it
With gold already drifting lower for four sessions, the key question into the Fed is whether a squeeze releases with momentum continuing down, or whether momentum flips and the release comes to the upside. The indicator does not need you to guess in advance. It waits for the market to show its hand.
05Step-by-Step: A Pre-Fed Squeeze Plan for Gold
Here is a simple, repeatable way to prepare for the October 27–28 meeting with XAUUSD on MT5:
Map the higher timeframe
Open an H4 or daily chart and note the direction of the last few swings and the key levels gold has reacted to this month, such as the $4,100 area mentioned in this week’s reports.
Attach Squeeze Momentum to H1
Load the indicator on the one-hour chart. This is where the pre-decision compression usually becomes visible first.
Watch for the squeeze to form
As the meeting approaches, look for the squeeze condition to appear and persist. A longer squeeze means more stored energy, not a reason to trade inside the range.
Wait for release plus momentum
Act only when the squeeze ends and the histogram confirms the direction on a closed candle. Ignore the first spike of the announcement minute; let the bar close.
Define risk before you enter
Place the stop beyond the squeeze range, size the position for event-level volatility, and decide in advance where you will take profit or trail the stop.
Spreads can widen sharply around a Fed decision. If your broker’s gold spread jumps, wait for it to normalise before acting on any signal.
06Starting Settings to Test
The indicator lets you adjust the Bollinger Band and Keltner Channel lengths and multipliers, and switch the True Range option on or off. The values below are common starting points for squeeze-style tools, not guaranteed optimal settings. Test them on gold in the Strategy Tester with the built-in tester panel before using them live.
| Setting | What it controls | Starting point to test |
|---|---|---|
| BB Length / Multiplier | How quickly the Bollinger Bands contract and expand | 20 and 2.0 on H1; lengthen the period on H4 for fewer, cleaner squeezes |
| KC Length / Multiplier | The volatility envelope the bands are compared with | 20 and 1.5; a higher multiplier marks more squeezes |
| Use True Range | Whether the Keltner Channels use true range, which includes gaps | On for gold, where gaps and fast spikes are common |
| Tester start date, TP and SL (points) | The period and exits the built-in tester uses | Start a few months back and test several SL and TP sizes, including wider ones for event days |
07Add Confirmation From Levels and Volatility
Squeeze releases work best when they line up with structure. Two simple additions make the setup more selective:
- Key levels: the Support and Resistance Levels indicator plots the zones gold is reacting to, so you can see whether a release is breaking a level or running straight into one.
- Volatility strength: the Waddah Attar Explosion indicator filters out weak expansions with its dead zone, which helps separate a real post-Fed move from a brief spike.
- Band context: the Fibonacci Bollinger Bands indicator adds Fibonacci-based levels to the Bollinger Bands, which are useful for planning exits once momentum is moving.
Because all of the Squeeze Momentum buffers are available to Expert Advisors, the whole plan can also be automated. If you would like an EA that waits for the squeeze, checks momentum and levels, and manages the trade for you, our algorithmic trading team can build it around your exact rules.
08Frequently Asked Questions
Does the Squeeze Momentum indicator predict the direction of the Fed move?
No. It identifies when volatility is compressed and confirms direction only after the squeeze releases and momentum agrees. That is its strength: it reacts to what the market does rather than forecasting the decision.
Which timeframe works best for gold around central bank meetings?
H1 is a practical balance for spotting pre-decision compression, with H4 or daily used for direction and levels. Lower timeframes produce more signals but also more noise during the announcement itself.
Should I act on a signal before the candle closes?
No. Read the squeeze release and arrows on closed candles only, especially during fast news bars, when an intrabar move can reverse before the candle finishes.
Can I use it in my own Expert Advisor?
Yes. The histogram, squeeze, buy and sell values are all exposed as buffers, so an EA can read them directly.
Be Ready Before Gold Breaks Out
The Fed decision is a scheduled catalyst, and quiet markets before big events rarely stay quiet. The Squeeze Momentum Indicator for MT5 shows you the coil as it forms and confirms the direction when it releases, so you prepare calmly instead of reacting late.
Get on MQL5 Market View product page
Want a fully automated version built around your own rules? Request a custom Expert Advisor.
Trading involves risk. This article is for educational and informational purposes only and is not financial advice. Market figures are taken from the sources linked above as of October 21, 2026.
Gold · indicators · mt5 · Squeeze Momentum · Volatility
Related articles

The Week That Changed Everything — How RMI Trend Sniper Would Have Caught Every Major Move
A historic forex week: FOMC split, Japan's ¥5.4T intervention and gold above $5,000. See how the RMI Trend Sniper MT5 indicator tracked every move.
Read more →
WTI Crude at $106: How to Trade the Hormuz Supply Shock with a Dedicated MT5 Indicator
WTI trades at $106 as the Strait of Hormuz stays blocked. How to trade the oil supply shock on MT5 with a dedicated crude…
Read more →
Trendlines Are Being Broken Everywhere Today — Here’s How to Trade Them on MT5
Gold broke $4,550, EUR/USD slid on tariff news and USD/JPY topped 160. How to trade broken trendlines on MT5 with the Trendlines with Breaks…
Read more →Need a team that can design, build and maintain it all?
Let's talk. Tell us about your project and we'll reply with honest timelines.