Support and Resistance Indicator MT5: Gold’s $4,000 Fed Test
Gold slipped under $4,000 an ounce last Friday for the first time since July, bounced back above it this week, and now meets the Federal Reserve decision with that round number sitting right underneath price. When a market keeps returning to one level, guessing is expensive. This guide shows how to use the Support and Resistance Levels indicator for MT5 to map gold’s support and resistance from real swings, see the moment a level breaks, and use a volume check to judge whether that break means anything, before and after today’s Fed statement.
01Why $4,000 is the level gold traders are watching
On Friday, 23 October, spot gold traded below $4,000 for the first time since July, closing out its weakest week in months. Reports linked the drop to a sell-off in technology and AI stocks that pushed investors to raise cash, and to higher oil prices that revived worries about inflation and rates staying high for longer (Arab Times, FinanceFeeds).
The metal then recovered. Spot gold was trading near $4,055 on Tuesday and around $4,040 in Asian trade on Wednesday morning, slightly lower on the day as oil prices rose again. In other words, price is sitting only a few dozen dollars above the level it just lost and regained.
The calendar makes that level even more important:
- Wednesday, 28 October, 2:00 pm ET: the Fed announces its decision. The current federal funds target range is 3.75% to 4.00%, and Chair Kevin Warsh speaks at 2:30 pm ET (Admirals).
- Context: the Fed raised rates by 25 basis points in September, its first hike in years, and markets mostly expect a hold today, with the debate focused on whether another hike follows in December.
- Thursday, 29 October, 8:30 am ET: September PCE inflation and third-quarter GDP data.
Two high-impact events in under 24 hours, with price parked just above a psychological level, is exactly when traders search for “gold support and resistance”. The question is not where gold will go, but which levels the market has actually respected, and how to tell a real break from a spike.
02How the Support and Resistance Levels indicator finds levels
Hand-drawn lines are subjective. Two traders looking at the same XAUUSD chart will rarely draw the same zones, and it is easy to forget to update them after a fast week. The SISCo indicator takes a rules-based approach:
Swing detection
Levels come from market swings, identified with two inputs: left bars and right bars. A swing high needs that many lower bars on each side.
Lookback range
The Lookback candles setting controls how far back the indicator searches, so you decide whether you want this week’s levels or last quarter’s.
Break detection
With break detection on, every break of support or resistance is marked on the chart as it happens.
Volume confirmation
When a level breaks, the indicator checks whether volume exceeds the set threshold. Only then does it generate a trading signal.
It works on all timeframes, offers custom colours for support and resistance lines, and has two parameters for real-time alerts and push notifications. That last point matters on a Fed day: you do not need to stare at the chart during the press conference to know a level has gone.
03Step by step: mapping gold’s levels before the Fed
Here is a simple routine for XAUUSD that you can complete before the 2:00 pm ET statement. Treat it as a preparation process, not a prediction.
Start on H4 for the big picture
Load the indicator on an XAUUSD H4 chart. Set a lookback long enough to include the July lows and the October sell-off so the major swing levels around $4,000 appear.
Note the nearest levels above and below price
Write down the closest support under the current price and the closest resistance above it. These are your reference points for the decision, not entry orders.
Drop to H1 for detail
Repeat on H1 with smaller swing values. You will see more, weaker levels. Keep the ones that sit close to the H4 levels, because overlap usually marks a more important zone.
Turn on alerts and break detection
Enable break detection and the alert or push notification inputs, so you are told when a level breaks during the statement, the press conference or Thursday’s PCE release.
Wait for the volume check
A break on its own is information; a break that passes the indicator’s volume threshold is a signal. Let the first candle after the news close before acting on either.
04Suggested settings for XAUUSD
The product page lists the inputs but does not publish recommended values, so the numbers below are starting points to test in the MetaTrader 5 Strategy Tester or on a demo account, not optimised settings. Larger swing values give fewer, stronger levels; smaller values give more, weaker ones.
| Timeframe | Use case | Lookback candles (starting point) | Left / right bars (starting point) |
|---|---|---|---|
| M15 | Intraday Fed-day reaction | 300 | 5 / 5 |
| H1 | Session and multi-day levels | 500 | 8 / 8 |
| H4 | Swing levels such as $4,000 | 500 | 10 / 10 |
| D1 | Major monthly zones | 250 | 5 / 5 |
Adjust the volume threshold to your broker’s tick volume data. Gold volume in MetaTrader 5 is usually tick volume, which varies between brokers, so a threshold that works on one feed may filter too much or too little on another.
05Reading breaks around the Fed decision
Central-bank days often produce a fast spike in one direction, then a reversal once the press conference starts. The indicator’s volume filter is designed to help separate breaks with participation from thin ones. A practical way to read the two sides:
📈 Bullish signal
- Price closes above the nearest resistance level and the break passes the volume threshold.
- The broken resistance holds as support on a pullback.
- The same level also appears on the higher timeframe.
- A bullish candlestick pattern forms at the retest.
📉 Bearish signal
- Price closes below support near $4,000 and the break passes the volume threshold.
- The broken support turns into resistance on a retest.
- Lower highs form on H1 after the statement.
- A bearish candlestick pattern appears at the retested level.
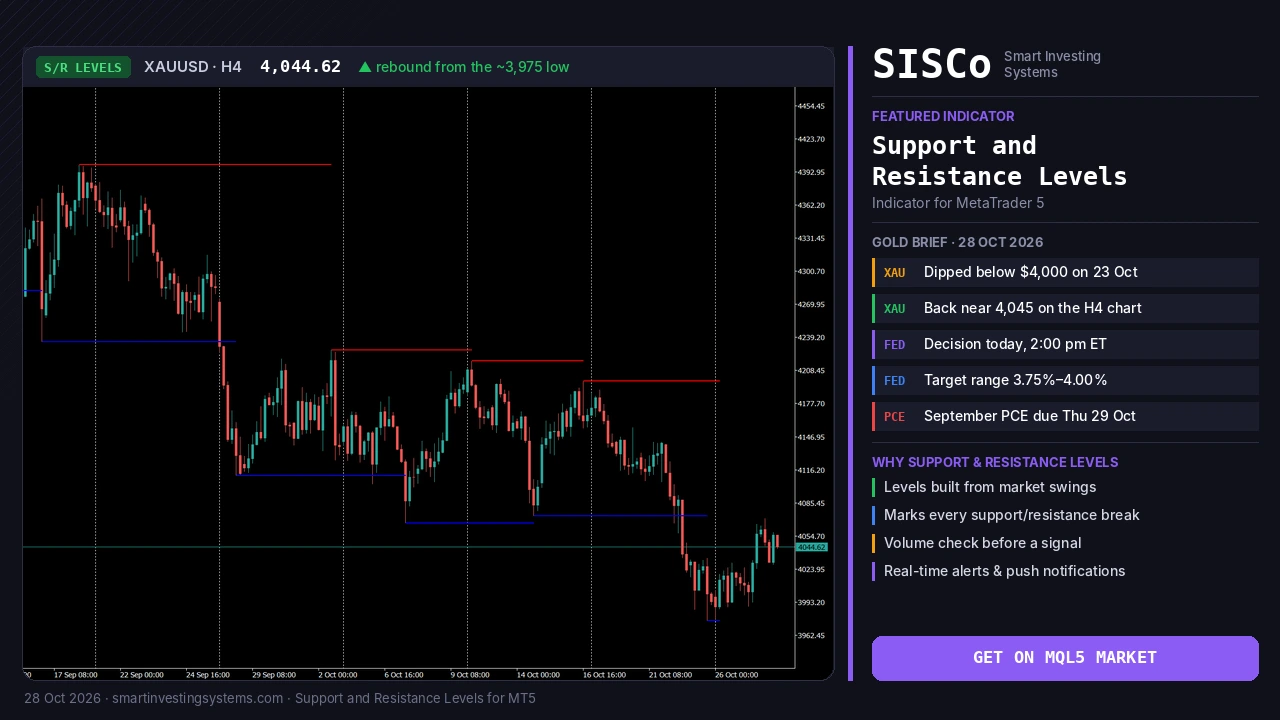
The XAUUSD H4 chart at the top of this article shows the pattern clearly. Since mid-September each new resistance line (red) has been drawn lower, from around 4,400 down to roughly 4,205 in October, while support lines (blue) near 4,240, 4,115 and 4,070 broke one after another. The last break pushed gold below $4,000 to a new support near 3,975, and price has since bounced back to about 4,045, still under the most recent broken support.
If a break happens on low volume and price quickly returns inside the level, treat it as noise rather than a signal. That pattern is common in the first minutes after a Fed announcement.
06Risk management for Fed and PCE releases
Support and resistance give you logical places for stops, which is one of the main uses the product page describes: put stops beyond a level instead of a random distance. On news days, a few extra precautions help:
Spreads on XAUUSD can widen sharply around 2:00 pm ET. A stop placed just a few dollars beyond a level may be hit by the spread alone.
Wait for at least one candle to close after the release before judging a break. Wicks through a level are not the same as closes beyond it.
Reduce position size on news days so a wider stop still keeps your risk per trade the same.
Remember Thursday’s PCE data. A level that holds on Wednesday can still break on Thursday morning.
07Building a fuller gold toolkit
Levels tell you where the market has reacted. Pairing them with a second tool can help you judge how price behaves when it gets there.
Candlestick confirmation
The CandleSticks Patterns indicator highlights reversal and continuation patterns, useful for checking a retest of a broken level.
Structure context
The Market Structure Break and Order Block indicator adds a Smart Money Concepts view of trend shifts around the same zones.
Automate your rules
If you already trade levels with fixed rules, SISCo can turn them into an Expert Advisor. See how a custom EA is built.
Frequently asked questions
What is the best support and resistance indicator for MT5?
The best tool is one that draws levels from clear rules you can test. The SISCo Support and Resistance Levels indicator builds levels from swing highs and lows, marks breaks and adds a volume check, so its levels are consistent and easy to review in the Strategy Tester.
Does the indicator work on gold (XAUUSD)?
Yes. It runs on any symbol and on all timeframes in MetaTrader 5, from scalping charts to position trading. Test the settings on your broker’s XAUUSD feed, because tick volume differs between brokers.
Can it alert me when $4,000 breaks during the Fed decision?
It alerts you when a support or resistance level it has detected breaks, including through push notifications. If $4,000 is one of those swing levels on your chart, you will be notified when it breaks.
Is there a free demo?
Yes. You can download a free demo from the MQL5 Market and run it in the MetaTrader 5 Strategy Tester before buying.
Map gold’s key levels before the next big release
Stop redrawing the same lines every week. Let the Support and Resistance Levels indicator find levels from real swings, flag every break and filter them with volume, then decide with a clear plan around the Fed and PCE data.
Trading involves risk, and you can lose more than you invest. This article is for education only and is not financial advice.
Related articles
Heikin Ashi RSI MT5: How to Read HARSI Candles (Gold Guide)
Learn how the Heikin Ashi RSI (HARSI) indicator for MT5 turns RSI into smooth candles, which settings to test, and how to read it…
Read more →
Trend Strength Index MT5: Is Gold’s Rebound Steady Before CPI?
Learn how the Trend Strength Index for MT5 shows how steady gold's rebound is before US CPI, with settings, signals and a step-by-step plan.…
Read more →
Convert MT4 EA to MT5: What OANDA’s MT4 Shutdown Means
Convert MT4 EA to MT5 before brokers like OANDA Japan switch off MT4. Learn what changes in MQL5, how to test it, and get…
Read more →Need a team that can design, build and maintain it all?
Let's talk. Tell us about your project and we'll reply with honest timelines.