WaveTrend Oscillator MT5: Signals, Settings and Gold Guide
If your RSI keeps telling you gold is “overbought” while price keeps climbing, the problem is not the market, it is the timing of the signal. The WaveTrend Oscillator fixes that timing issue in a simple way: it does not fire when a level is touched, it waits for momentum to reach an extreme and then turn. This guide explains how the WaveTrend Oscillator works in MetaTrader 5, how to read its buy and sell signals, which settings to test, and how to apply it to a live example: gold slipping back toward $4,000 after the Federal Reserve held rates this week.
01What the WaveTrend Oscillator is
WaveTrend is a momentum oscillator that became popular among TradingView users and is now widely used on MetaTrader. It measures how far price has stretched away from its own smoothed average and plots that stretch as a wave that swings above and below zero. When the wave reaches an extreme and starts to roll over, momentum is fading and a turn becomes more likely.
Our WaveTrend Oscillator Indicator for MT5 is built from two exponential moving averages (EMAs). Its rules are clear and easy to follow:
- Sell signal: the lines rise above 53 and then turn back down.
- Buy signal: the lines fall below -53 and then turn back up.
That “go past the level, then turn” logic is the whole idea. It makes WaveTrend useful for spotting trend reversals, scalping on lower timeframes and catching larger swing turns on higher ones.
Two EMA lines
The oscillator is built from two exponential moving averages, so it reacts to recent price faster than a simple average would.
Fixed extremes
The +53 and -53 zones mark where momentum is stretched. Readings between them are normal market noise.
Turn confirmation
A signal only appears once the lines reverse from an extreme, which filters out many “too early” entries.
02WaveTrend vs RSI and Stochastic
RSI and Stochastic are excellent tools, but both have a known weakness: a strong trend can keep them pinned in overbought or oversold territory for a long time. Traders who sell the moment RSI crosses 70 often get run over, because the level was touched while momentum was still pushing.
WaveTrend handles this differently. Crossing +53 is not a sell on its own. The indicator waits for the lines to hook back down, which means momentum has actually started to fade. You give up a little of the move, but you avoid many of the entries that happen in the middle of a strong push.
| Feature | RSI / Stochastic | WaveTrend Oscillator |
|---|---|---|
| When a signal appears | As soon as a level is touched or crossed | After the lines reach an extreme and then turn |
| Extreme zones | 70/30 (RSI) or 80/20 (Stochastic) | +53 / -53 |
| Behaviour in strong trends | Can stay overbought or oversold for many bars | Still stretched, but waits for a turn before signalling |
| Best use | General momentum reading | Timing reversals and pullback entries |
If you prefer a smoother RSI-style line, the Laguerre RSI Indicator for MT5 is a good companion to compare against. Many traders run both and only act when they agree.
03How to read WaveTrend buy and sell signals
The signals are simple, but reading them well takes a little context. Treat the turn from an extreme as an alert that momentum is changing, then check where price is on the chart before you act.
📈 Bullish signal
- The WaveTrend lines drop below -53 (oversold zone).
- The lines then turn back up.
- Stronger when price is sitting on a known support level.
- Stronger still when the higher timeframe trend is up and this is a pullback.
📉 Bearish signal
- The WaveTrend lines rise above +53 (overbought zone).
- The lines then turn back down.
- Stronger when price is testing a known resistance level.
- Stronger still when the higher timeframe trend is down and this is a bounce.
Two common mistakes are worth avoiding. First, do not sell every turn from +53 in a market that is trending hard upward; in strong trends, turns from the opposite extreme (buying dips) usually work better. Second, do not treat a weak turn just above or below the line as equal to a deep turn from far beyond it. A wave that pushes well past the extreme before turning shows a more stretched market.
04WaveTrend settings to test
The settings of the SISCo indicator are split into two groups: calculation settings, which control how the oscillator is built, and tester and signal settings, which let you test signals in the Strategy Tester and send alerts. The product description recommends starting with the default calculation settings, and that is good advice. Change how you use the signals before you change how they are calculated.
The table below shows starting points to test, by trading style. These are suggestions to try on a demo account, not proven optimal values.
| Trading style | Timeframe to test | How to use the signals | Confirmation to add |
|---|---|---|---|
| Scalping | M5 – M15 | Take turns from ±53 in the direction of the H1 trend only | Session timing; avoid the minutes around big data releases |
| Intraday | M30 – H1 | Buy turns from -53 near support, sell turns from +53 near resistance | Horizontal support and resistance levels |
| Swing trading | H4 – D1 | Fewer, larger turns; use them to time entries into the main trend | Higher timeframe trend and price structure |
| Signal testing | Any | Use the built-in tester and signal settings to review past signals | A demo run in the MT5 Strategy Tester before going live |
Lower timeframes give more signals and more noise. If you scalp with WaveTrend, filter trades by the higher timeframe direction.
Change one thing at a time when testing. If you change the timeframe and the filter together, you will not know which change helped.
05Step-by-step: setting up WaveTrend in MT5
Install and attach
Download the indicator from the MQL5 Market (a free demo is available), open your chart and drag the WaveTrend Oscillator onto it. It appears in a separate window under price.
Keep the default calculation settings
Start with the defaults so your results are comparable with other users and with the product description.
Mark your key levels
Draw the nearest support and resistance on the price chart. WaveTrend tells you when momentum turns; levels tell you where a turn matters.
Wait for a turn from an extreme
Look for the lines above +53 turning down for sells, or below -53 turning up for buys. Ignore turns that happen in the middle of the range.
Test, then set alerts
Use the tester and signal settings to review how the signals behaved on your symbol and timeframe, then turn on alerts so you do not have to watch the chart all day.
06A live example: gold after the Fed hold
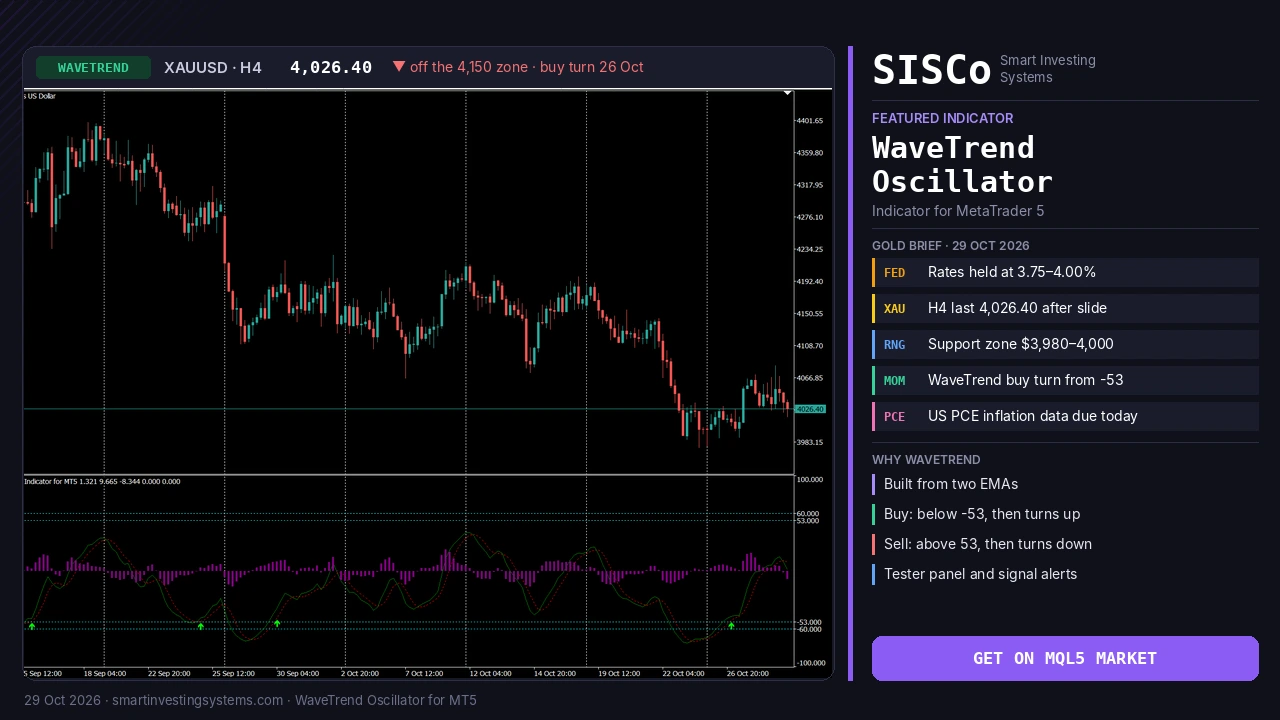
This week gives a clean example of why “wait for the turn” matters. On 28 October the Federal Reserve kept its policy rate in the 3.75%–4.00% range, as markets expected. Gold slipped after the decision: spot gold was trading around $4,038 in Asian hours on 29 October, down about 0.7% on the day, according to a Reuters report carried by Business Recorder. Mitrade’s analysis put the post-decision low near $4,035, with the next support zone around $3,980–$4,000. Traders were also waiting for US PCE inflation data due on 29 October.
The H4 chart at the top of this article shows the setup. Gold drifted lower from near $4,400 in mid-September, spent early October in a range of roughly $4,100–$4,200, then dropped toward the $3,983 area around 22–24 October. During that drop the WaveTrend lines fell below -53 and even -60, then turned back up, and a buy arrow printed around 26 October before price bounced toward $4,066. Earlier buy arrows in mid- and late September also came from turns near the -53 zone. At the time of the screenshot gold stood at 4,026.40, with the WaveTrend lines just above zero and starting to roll over, so momentum had cooled again after the bounce.
How would a WaveTrend trader approach a market like this?
- On H1 or H4: if the slide toward $4,000 pushes WaveTrend below -53 and the lines then turn up close to that $3,980–$4,000 area, that is a buy alert worth studying, because the momentum turn lines up with a well-watched support zone.
- If the lines stay pinned below -53 with no turn: sellers are still in control. A WaveTrend trader waits rather than guessing the bottom.
- Around the PCE release: data candles can push the oscillator to extremes in one bar. Many traders let the first spike pass and only act on a turn that forms after volatility settles.
The point is not to predict where gold goes next. It is to have a clear rule for when momentum has actually changed, and to combine that rule with the levels everyone is watching. A tool like the Support and Resistance Levels Indicator for MT5 can mark those zones for you.
07Turning WaveTrend into an automated strategy
Because WaveTrend has fixed, rule-based signals, it is a natural candidate for automation. A custom Expert Advisor can check for a turn from ±53, confirm it with a trend filter or support and resistance level, and then manage entries, stop losses and exits the same way every time, without emotion.
SISCo has built more than 1,549 trading systems since 2017. If you want WaveTrend signals inside your own EA, combined with your filters and money management, see how we build custom Expert Advisors or read more about our algorithmic trading development service.
08WaveTrend Oscillator FAQ
When does WaveTrend give a buy signal?
When the lines fall below -53 and then turn back up. The turn is the signal, not the cross below -53 on its own.
When does it give a sell signal?
When the lines rise above +53 and then turn back down. In a strong uptrend, treat these as warnings to protect profits rather than automatic short entries.
Can I use WaveTrend on its own?
It is better not to. The product description itself advises integrating it into your own system and combining it with support and resistance, price action or other MT5 indicators.
Is there a free demo?
Yes. You can download a free demo from the MQL5 Market and run it in the MetaTrader 5 Strategy Tester before buying.
Try the WaveTrend Oscillator on your own charts
Test the buy and sell turns on gold, forex pairs or indices in the MT5 Strategy Tester with the free demo, then use the built-in alerts to follow signals live. Need it inside an EA? Our team can build it for you.
Trading involves risk and you can lose money. This article is for education only and is not financial advice.
Gold · indicators · mt5 · WaveTrend
Related articles
Heikin Ashi RSI MT5: How to Read HARSI Candles (Gold Guide)
Learn how the Heikin Ashi RSI (HARSI) indicator for MT5 turns RSI into smooth candles, which settings to test, and how to read it…
Read more →
Trend Strength Index MT5: Is Gold’s Rebound Steady Before CPI?
Learn how the Trend Strength Index for MT5 shows how steady gold's rebound is before US CPI, with settings, signals and a step-by-step plan.…
Read more →
Convert MT4 EA to MT5: What OANDA’s MT4 Shutdown Means
Convert MT4 EA to MT5 before brokers like OANDA Japan switch off MT4. Learn what changes in MQL5, how to test it, and get…
Read more →Need a team that can design, build and maintain it all?
Let's talk. Tell us about your project and we'll reply with honest timelines.