

Volume tells you how much trading activity occurred on a candle. Cumulative Delta Volume tells you which side of the market controlled that activity. It is one of the most underused concepts in retail forex trading — and in a week where gold has slipped to one-month lows near $4,590, EUR/USD is testing the 1.1710 level with six central bank decisions in four days, the ability to read order flow rather than just price is no longer optional. It is a genuine edge.
The Cumulative Delta Volume (CDV) Indicator for MT5 quantifies the difference between buying and selling volume on each candle and accumulates that difference over time — giving you a real-time view of institutional order flow that most retail traders never see. This article explains exactly how to use it, and why this week in particular is the right time to add it to your workflow.
01What Is Cumulative Delta Volume — and Why Price Alone Isn’t Enough
Every candlestick on your chart tells you four things: the open, high, low, and close. What it does not tell you is whether the buying volume or the selling volume was dominant during that candle’s formation. Two candles can look identical in terms of price range and close — but one may have been driven by aggressive buyers lifting the ask, while the other was driven by sellers hitting the bid. That distinction changes everything about how you should interpret the move.
Delta volume is the difference between buying volume (transactions that occurred at the ask) and selling volume (transactions that occurred at the bid) within a single candle. A positive delta means buyers were more aggressive. A negative delta means sellers were more aggressive.
Cumulative delta accumulates these values over time — building a running total that shows you when institutional order flow is genuinely aligned with price direction, and — critically — when it is not.
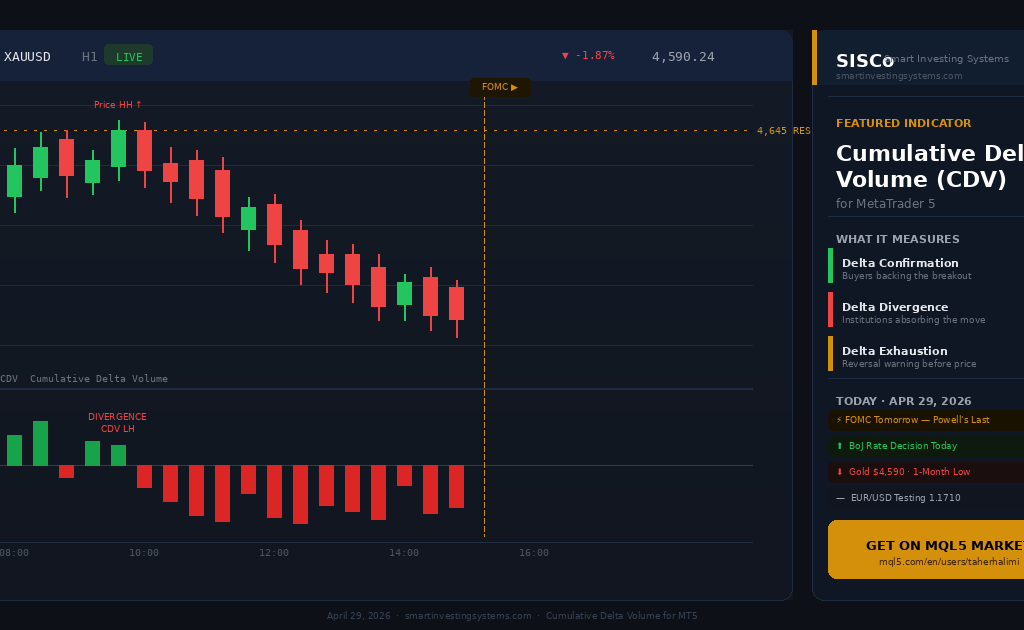
Delta Divergence
Price makes a new high but CDV fails to confirm with a new peak. Institutional sellers are absorbing the move — a reversal warning most price-only traders miss entirely.
Delta Confirmation
Price breakout is accompanied by a surge in positive cumulative delta. Buyers are genuinely in control. This is the confirmation that separates real breakouts from fakeouts.
Delta Exhaustion
Cumulative delta makes an extreme reading in one direction while price consolidates. Aggressive one-sided order flow is meeting supply or demand — often the last signal before a sharp reversal.
02The Three Market States CDV Identifies
Before applying the indicator, you need to understand what it is actually measuring in each market condition. CDV reads very differently depending on whether the market is trending, reversing, or distributing.
Trending Bullish
Price makes higher highs and CDV rises in parallel. Buying pressure is genuine and increasing. Trend continuation setups are valid — pullbacks to rising CDV are high-probability entries.
Trending Bearish
Price makes lower lows and CDV drops in parallel. Selling pressure is dominant. Any rally that fails to push CDV back into positive territory is a potential continuation short.
Divergence / Distribution
Price and CDV disagree. This is the most important condition — it signals that the side driving price does not have genuine order flow support. Reversals and traps are most common here.
This week, with gold slipping from its $4,645 highs to $4,590 despite ongoing Strait of Hormuz tensions, CDV divergence has been precisely the signal that preceded the selloff — price was holding while cumulative selling delta was quietly building. Traders watching only candlesticks saw strength. Traders watching delta saw distribution.
03Reading CDV Signals: Bullish vs. Bearish Setups
The practical application of CDV comes down to recognising two primary signal types — confirmation and divergence — across both directional biases.
- →Price breakout above resistance + CDV surging positive
- →Pullback to support with CDV holding above zero line
- →CDV makes new high before price does — leading indicator
- →Seller exhaustion: CDV spikes negative then reverses sharply
- →Price at resistance + CDV turning negative on the approach
- →Price new high but CDV makes a lower high — classic divergence
- →Rally on declining CDV — buyers aren’t backing the move
- →Buyer exhaustion: CDV spikes positive then collapses
The divergence signal is the one that generates the most consistent high-probability trades. When EUR/USD was grinding toward 1.1820 last week, cumulative delta on the H1 chart was already declining — the buying pressure that had lifted price from 1.1600 was quietly being absorbed. That divergence resolved with the retracement back to 1.1710 support that the market is currently navigating.
04CDV Parameters — What to Configure and Why
The CDV Indicator for MT5 gives you control over the key variables. Knowing what each parameter actually does determines whether the tool gives you useful signal or noise.
| Parameter | Effect | Recommended Setting |
|---|---|---|
| Reset Period | How often the cumulative total resets to zero. Session-based resets show intraday order flow; no reset shows longer-term accumulation. | Session reset for intraday; none for swing |
| Volume Type | Tick volume (available on all brokers) vs real volume (requires ECN broker data). Tick volume is a reliable proxy for most forex pairs. | Tick volume for forex pairs |
| Color Sensitivity | The threshold at which delta is considered significantly positive or negative. Too tight = noise; too wide = late signals. | Calibrate to average candle volume on your pair |
| Histogram Smoothing | Applies a moving average to the delta bars, reducing noise at the cost of some lag. | Off for scalping; 3-period MA for swing |
05A Step-by-Step Framework: Trading This Week’s Events with CDV
With the FOMC decision tomorrow, BoE and ECB on Thursday, and US GDP + Core PCE data also releasing, this is the highest-impact week of the quarter for forex volatility. Here is exactly how to use CDV around high-impact events.
Establish the pre-event CDV baseline
In the two to four hours before a major release (FOMC, GDP, CPI), note the CDV trend. Is it rising, falling, or flat? This tells you where institutional positioning is before the event — not where the market will go, but where smart money was leaning into the news.
Watch the spike candle’s delta, not just its close
When the news drops, price moves sharply. Most traders react to the candle close. CDV traders watch whether the spike candle carries a delta consistent with the direction — or whether it is a thin, low-volume move that the market is likely to fade. A large news candle with near-zero or opposing delta is a fade candidate.
Wait for the post-spike retest and CDV confirmation
After the initial move, price almost always retests the breakout level. This is your entry window. If CDV is rising on the retest (for a long) or falling (for a short), order flow is confirming the new direction. This is the highest-probability entry in event-driven trading.
Use CDV to manage the trade, not just the entry
Once in a trade, monitor CDV on a lower timeframe. If price is holding its level but CDV is drifting against you, reduce position size or tighten your stop — the order flow signal is warning that the move may be losing genuine momentum before price confirms it.
Exit on delta exhaustion, not just price targets
The cleanest exits come when CDV makes an extreme reading and then reverses — even if price has not yet reached your target. Delta exhaustion often precedes price reversal by one to three candles, giving you time to exit at a more favourable level than a standard price-based target would allow.
06Common CDV Mistakes to Avoid
Treating every delta divergence as an immediate reversal signal. Divergence can persist for many candles in a strongly trending market. Divergence is a warning that momentum is weakening — not a standalone entry trigger. Always combine it with a structural signal: a failed swing high, a CHOCH, or a key level being tested.
Using CDV without a defined reset period. If cumulative delta is never reset, the line drifts further from zero indefinitely and loses interpretive value. Define whether you are measuring session delta, daily delta, or rolling delta — and stick to one context per chart setup.
Applying CDV on timeframes below M5 in volatile sessions. During high-impact news releases, tick volume spikes create delta readings that are too noisy to interpret meaningfully on M1. Drop to M5 as your minimum during event windows — the signal clears considerably.
Ignoring pair-specific volume behaviour. EUR/USD and GBP/USD carry far higher tick volume than exotic pairs. A “large” delta reading on EUR/USD would be an extreme outlier on USD/ZAR. Calibrate your sensitivity thresholds per pair, not globally across your watchlist.
07Why CDV Belongs in Your Toolkit This Week
This is not a normal trading week. Between today’s Bank of Japan decision — with USD/JPY sitting just below the critical ¥160 level where intervention risk is highest — and tomorrow’s FOMC (the last meeting chaired by Jerome Powell before Kevin Warsh takes over), the market is priced for movement in every major pair simultaneously.
In environments like this, price action alone becomes unreliable. False breakouts multiply. Liquidity sweeps are engineered before the real move begins. The traders positioned on the wrong side of a news spike are almost always those who reacted to price without understanding the order flow underneath it.
CDV provides the layer of context that price cannot. It shows you, in real time, whether the institutions moving markets are genuinely committing capital to a direction — or whether a move is thin and likely to reverse. That information, applied consistently through a structured framework like the one above, is what separates reactive trading from informed decision-making.
See Exactly Who Is Driving Price — In Real Time
The CDV Indicator for MT5 displays cumulative buying and selling delta directly on your chart, with configurable reset periods, color-coded histogram, and full EA compatibility. Built for traders who want to trade order flow, not just price.
↗Conclusion
Every price move has a volume story behind it. Cumulative Delta Volume is the tool that reads that story in real time — separating genuine institutional commitment from retail-driven noise that evaporates the moment a key level is tested.
In a week featuring the FOMC, BoJ, BoE, ECB, US GDP, and Core PCE all within four trading days, the markets will move. CDV does not tell you which direction they will move — but it tells you, with real data, whether that direction has genuine institutional backing behind it. That is the difference between guessing and trading with an edge.