

This is one of the most common and costly patterns in retail trading — and it happens because most breakout strategies have a fatal flaw: they rely on price alone, with no way to measure whether real momentum is behind the move.
A price breakout without momentum is just a trap. And in 2026, with algorithmic players actively engineering stop runs around key levels, trading breakouts blindly is more dangerous than ever.
The Waddah Attar Explosion indicator for MetaTrader 5 was built specifically to address this problem. It does not just show you that price moved — it shows you whether there was genuine energy behind the move, and filters out the low-activity noise that causes false entries.
01What Is the Waddah Attar Explosion?
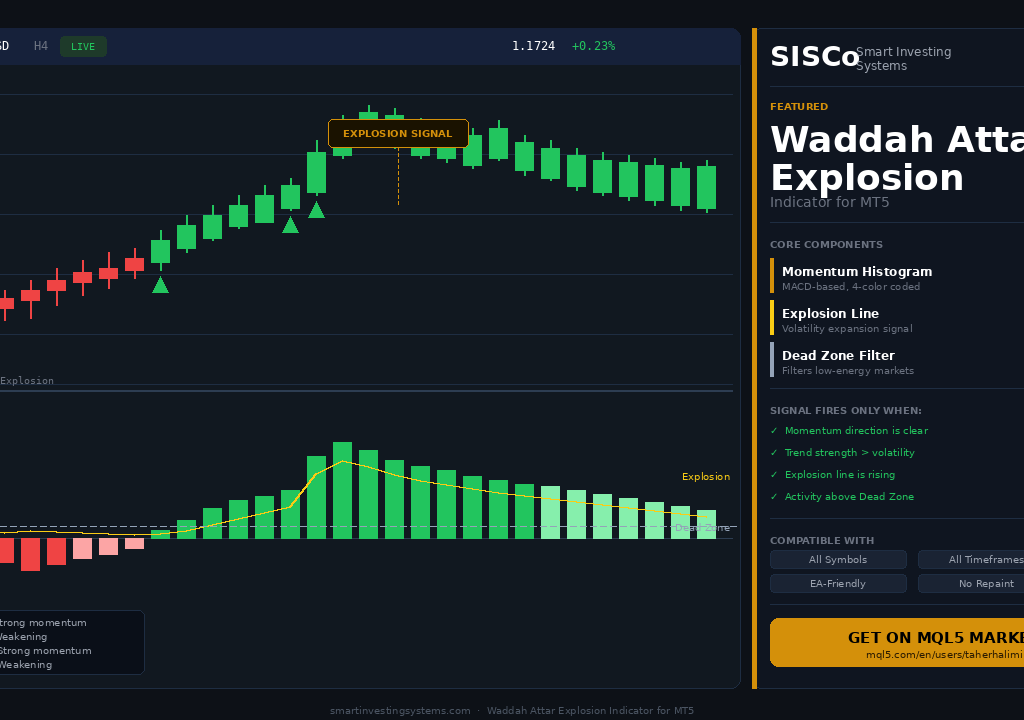
The Waddah Attar Explosion (WAE) is a momentum and volatility-based indicator that combines three distinct calculations into a single, clean display in a separate chart window:
Trend Momentum
MACD-style EMA acceleration measuring whether momentum is genuinely building in a direction.
Volatility Expansion
Standard deviation (Bollinger-style) confirming whether price is expanding out of its recent range.
Dead Zone Filter
Dynamic floor from the average true range that filters out all signals when market activity is too low to trade.
When all three align — momentum is directional, volatility is expanding, and activity is above the dead zone — the indicator fires. When they do not, it stays quiet. This multi-condition design is what separates the WAE from simple momentum oscillators that signal constantly regardless of market conditions.
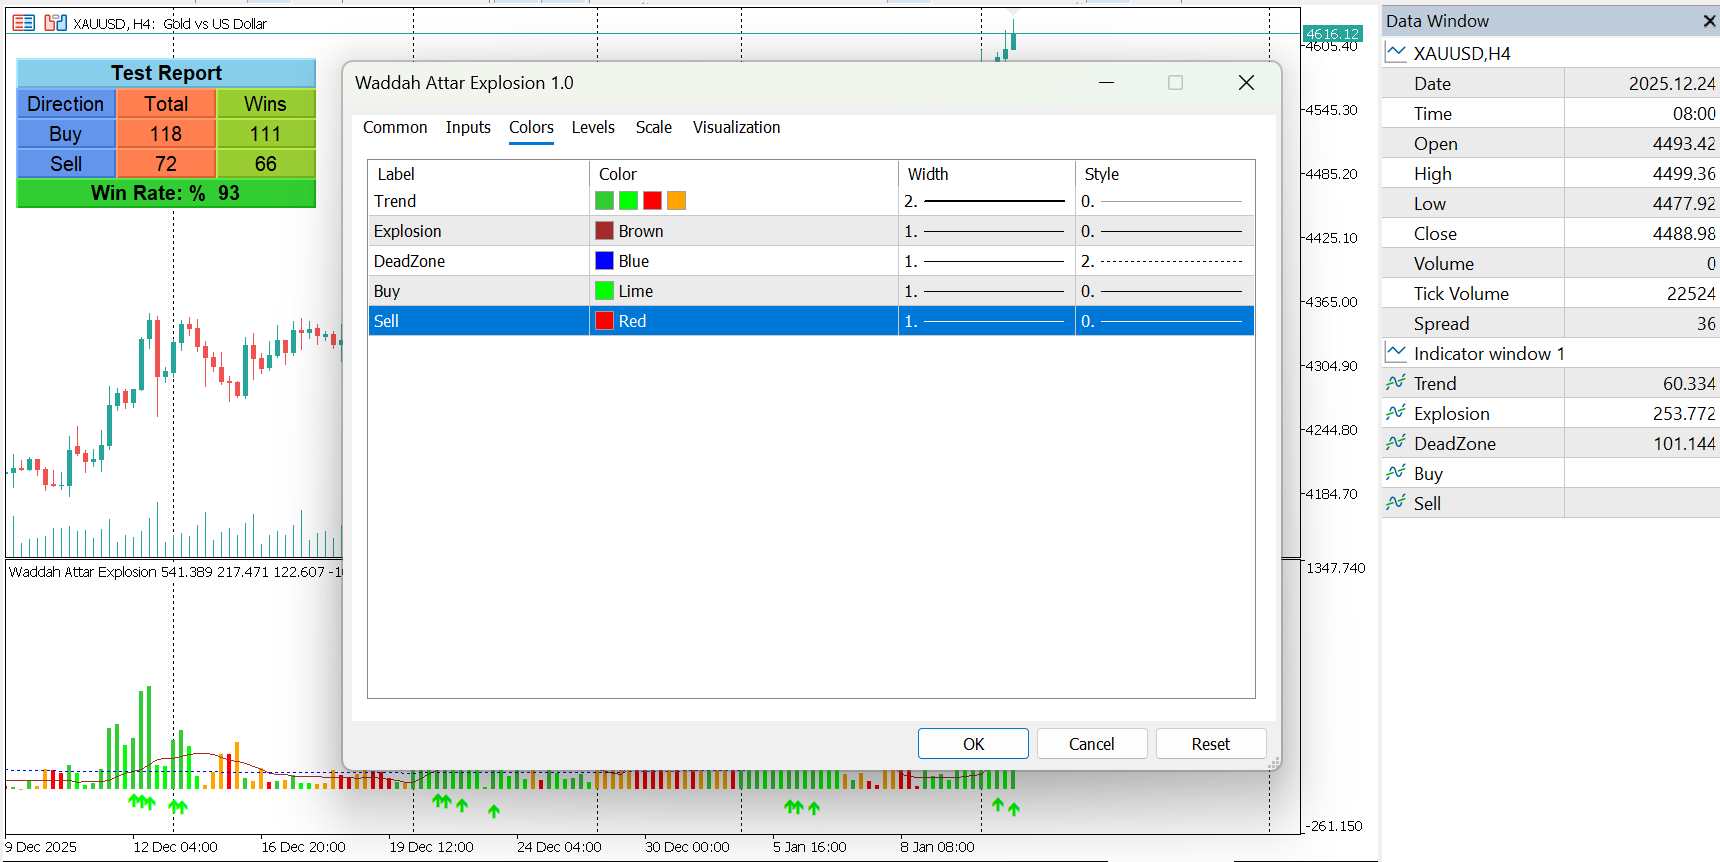
02Understanding the Visual Elements
The WAE indicator in a separate sub-window — histogram, Explosion Line, Dead Zone, and signal arrows
The indicator displays in a sub-window below your main chart with four key visual elements:
⚡ Explosion Line
The volatility expansion threshold. A signal only has meaning when the histogram clears above this line. Below it = low-energy move, avoid it.
🚫 Dead Zone Line
The low-activity filter. Any reading below this line should be ignored. The market is saying there is not enough participation here to trade.
🟢 Buy Arrows
Appear on the main chart only when all conditions are simultaneously met — momentum, volatility, and activity aligned.
🔴 Sell Arrows
Same logic, bearish direction. The arrow only fires when the histogram clears both the Explosion Line and the Dead Zone.
03The Dead Zone: The Feature Most Traders Overlook
Most momentum indicators generate signals every few bars. This sounds useful until you realize that most of those signals appear during low-volume, sideways markets — exactly when you should not be trading.
The Dead Zone filter changes this entirely. Think of it as an energy threshold. If the market is not generating enough volatility to clear the Dead Zone line, the indicator produces no arrows. You do not have to decide whether to take a signal — the indicator has already made that decision for you.
This is particularly valuable during:
Asian Session
Forex markets are notoriously quiet and prone to false, low-conviction moves that reverse sharply at London open.
Pre-News Consolidation
Price compresses before a major economic release. The Dead Zone keeps you out until the real move develops.
Weekend Gap Fills
Early Monday price action can be disorderly. Low activity stays below the Dead Zone, protecting you automatically.
04Buy, Sell & Exit Signal Logic
Buy and sell arrows fire only when all four conditions are simultaneously confirmed
Signals are generated only when all four conditions are met at the same time:
- 1Green histogram bar is rising (bullish momentum building)
- 2Green histogram is above the Explosion Line
- 3The Explosion Line itself is rising (volatility expanding)
- 4Both readings are above the Dead Zone
- 1Red histogram bar is rising (bearish momentum building)
- 2Red histogram is above the Explosion Line
- 3The Explosion Line itself is rising
- 4Both readings are above the Dead Zone
- →The histogram (green or red) starts declining and crosses back below the Explosion Line — momentum is exhausting, close the trade.
This last point matters: the WAE does not just help you enter — it also gives you a clear, objective exit trigger. When the histogram fades back below the Explosion Line, the energy is gone. That is your signal to close.
05Practical Strategy: WAE With Trend Context
The Waddah Attar Explosion works best when combined with a higher timeframe trend filter. Here is a clean, repeatable approach:
Identify the higher timeframe trend
Use a 4H or Daily chart and determine the dominant direction. Higher highs and higher lows = uptrend. Lower highs and lower lows = downtrend.
Drop to your entry timeframe
Switch to a 1H or 15M chart where you will watch for WAE signals aligned with the higher timeframe direction.
Wait for WAE alignment
Take only buy signals when the higher timeframe trend is bullish. Take only sell signals when bearish. This single filter ensures you trade with institutional flow, not against it.
Confirm at a key level
The highest-probability setups occur when a WAE signal fires at or near a significant support (for buys) or resistance (for sells), adding structural confluence.
Manage the trade objectively
Hold as long as the histogram stays above the Explosion Line. When it crosses back below, close. Simple. Objective. Repeatable.
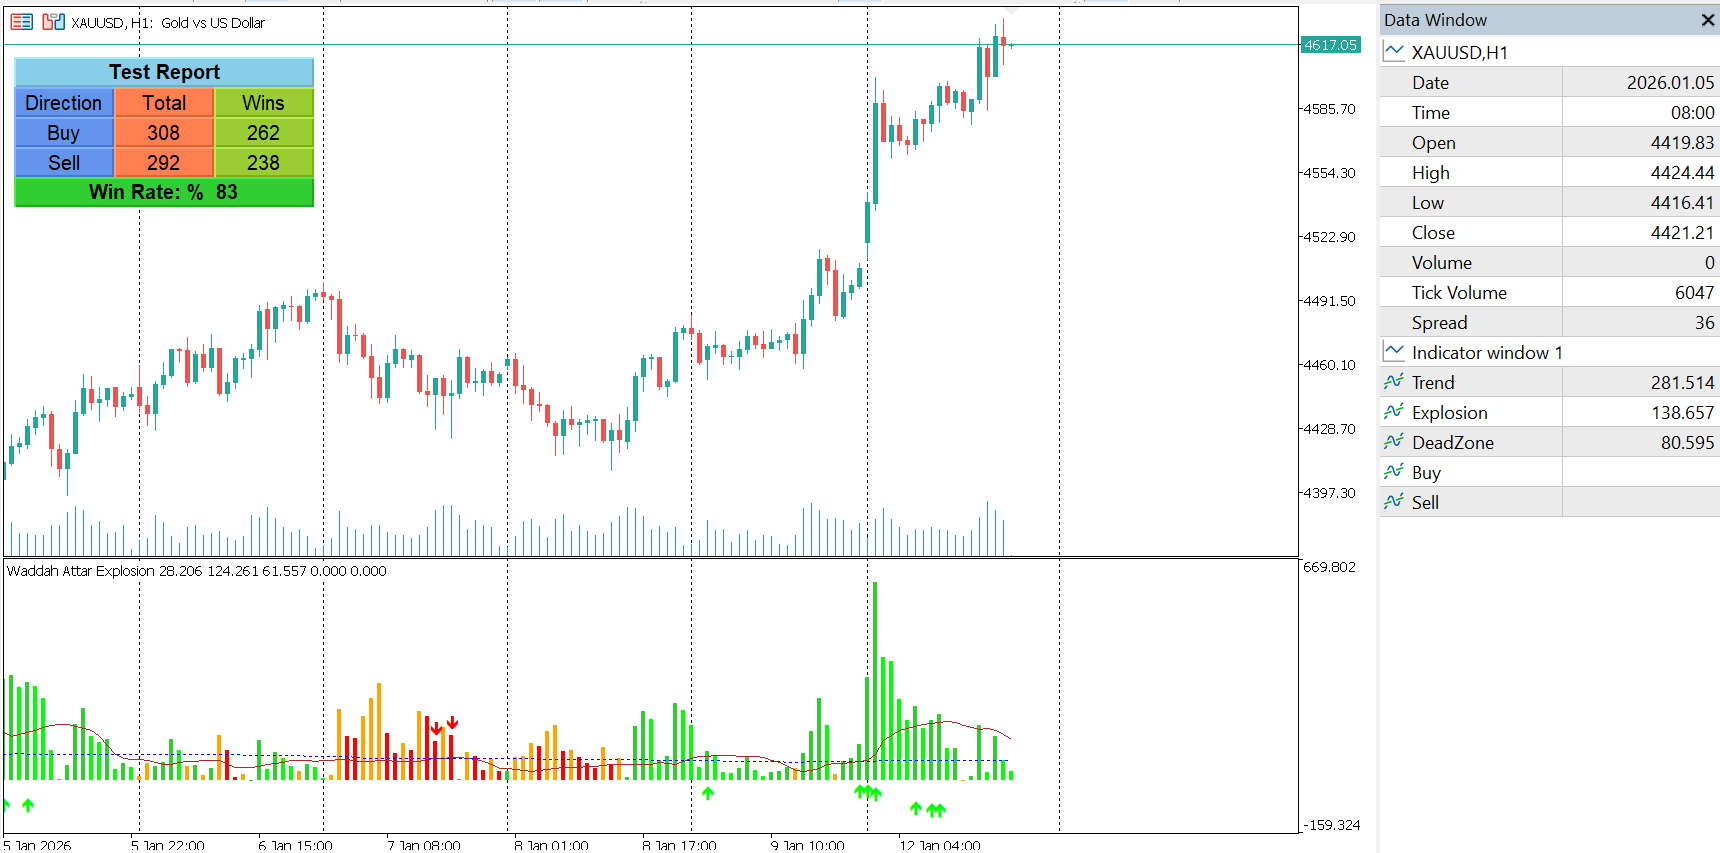
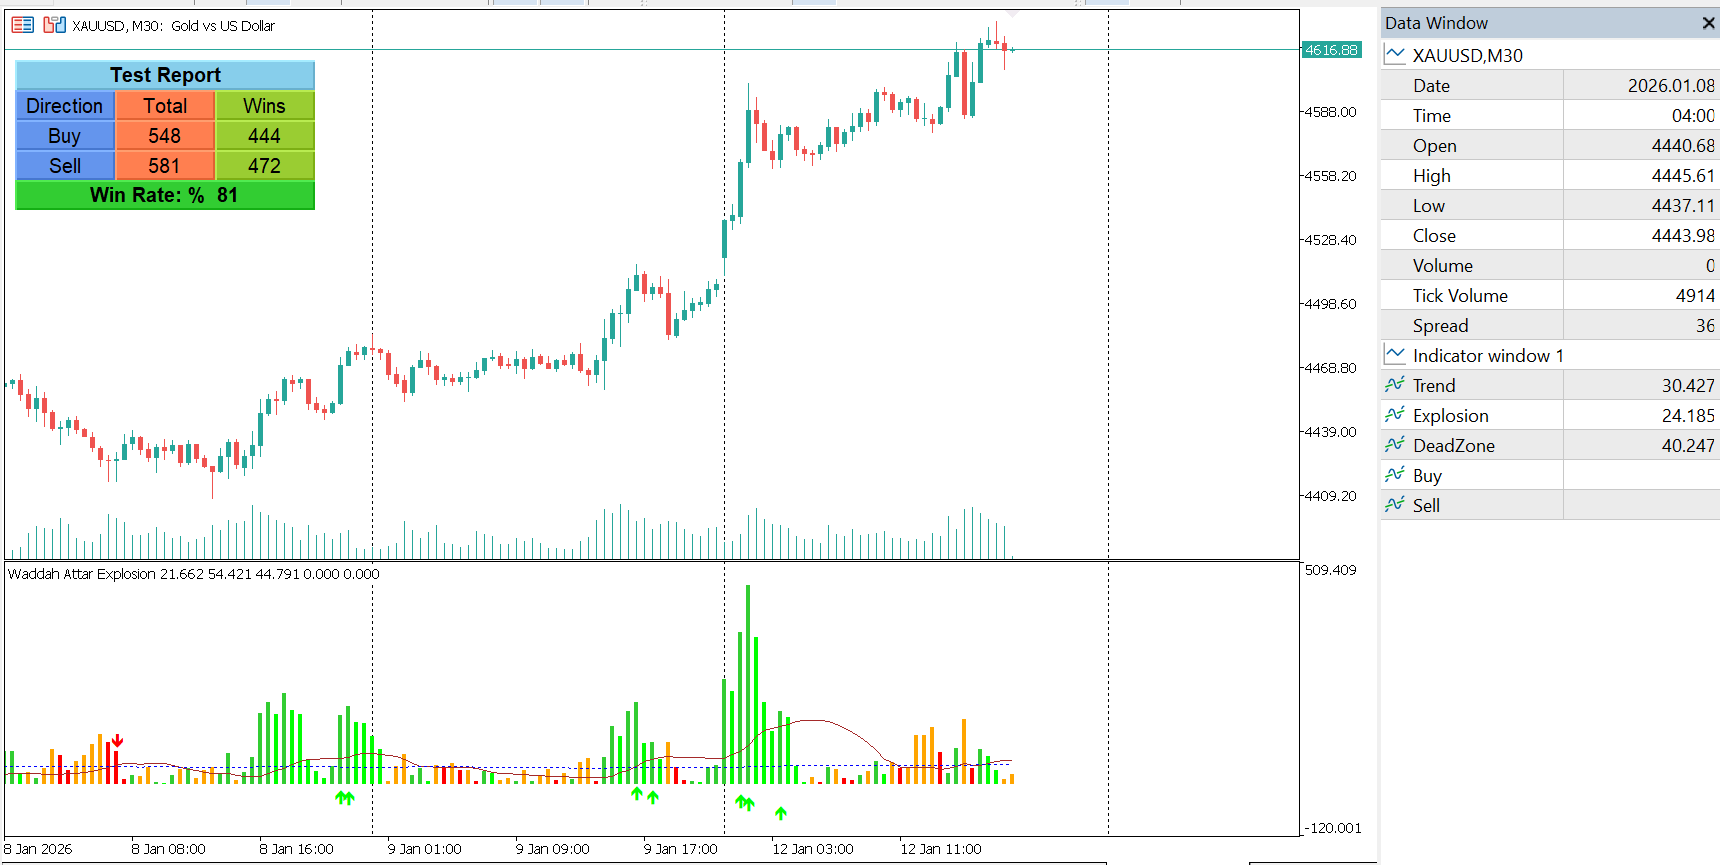
06The Built-In Signal Tester
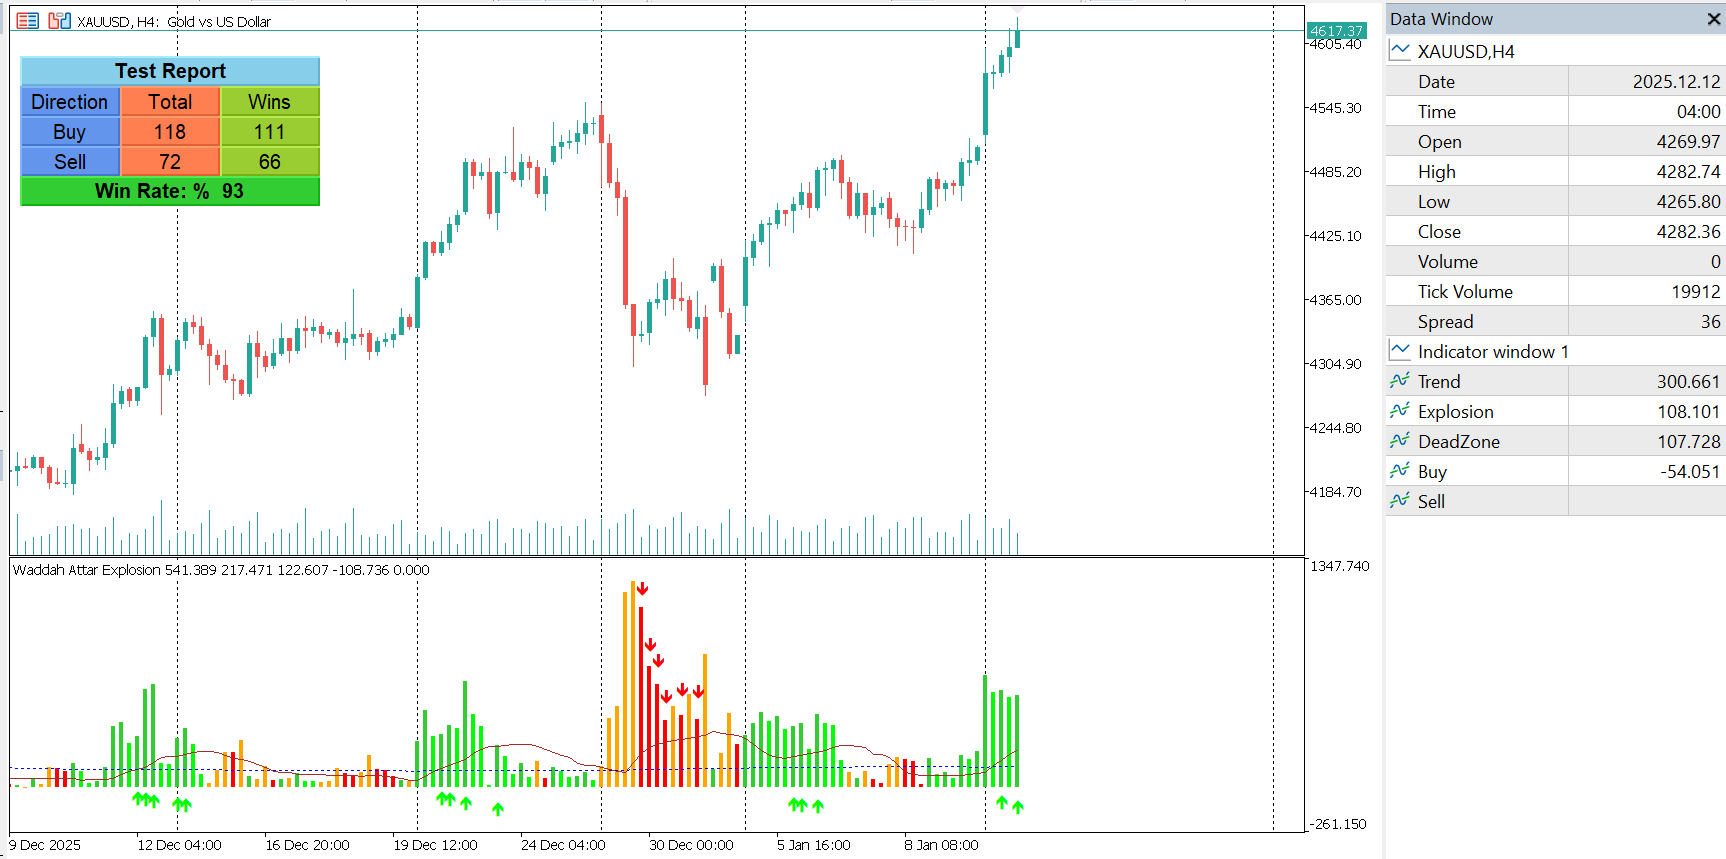
The on-chart tester displays total trades, wins, and win rate — no separate backtesting software required
One feature that sets this indicator apart from most commercial tools is the on-chart signal tester — built directly into the indicator with zero extra setup.
Define a take-profit level, a stop-loss level, and a start date. The tester then simulates every historical buy and sell signal over that period and displays on your chart: total trades simulated, number of winning trades, and the win rate percentage.
This is not backtesting software — it is a fast, visual way to evaluate how the indicator performs on your specific symbol and timeframe, without opening a strategy tester or writing any code. Use it to calibrate the sensitivity settings before going live.
07Customization: Adapting to Your Market
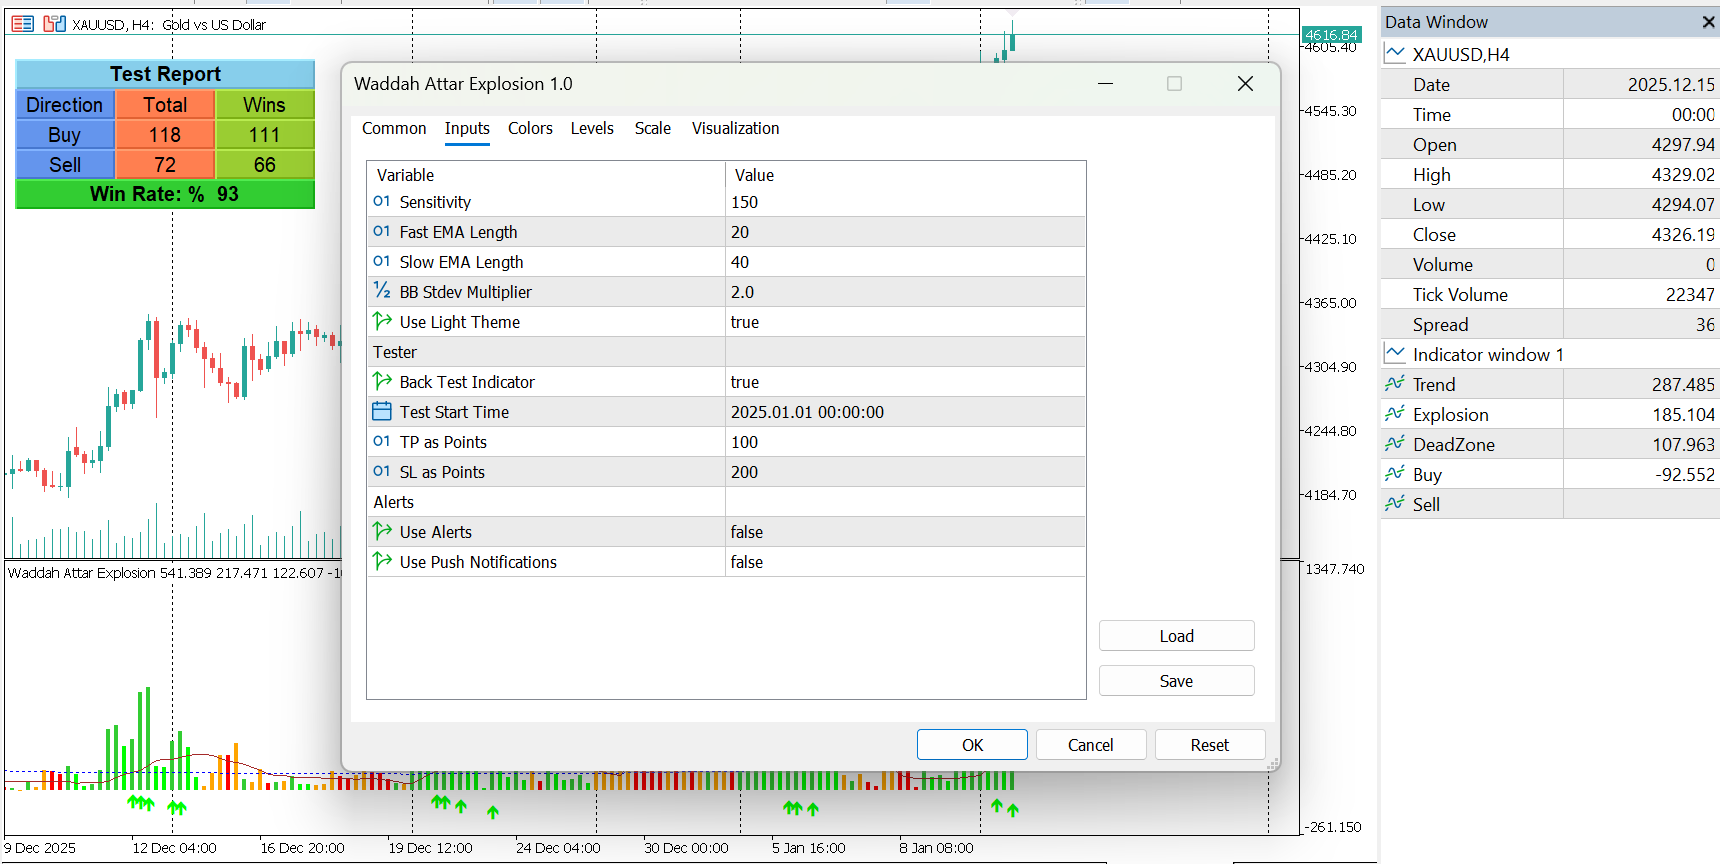
Full parameter control lets you tune the indicator to each symbol and timeframe
Every market behaves differently. Gold has different volatility characteristics than EUR/USD. Crude oil trades differently than GBP/JPY. The WAE includes full parameter control:
| Parameter | What It Controls |
|---|---|
| Sensitivity | How strongly momentum acceleration is amplified — higher = faster reaction |
| Fast EMA Length | Speed of the fast exponential moving average |
| Slow EMA Length | Speed of the slow exponential moving average |
| Channel Length | Period for the volatility (Bollinger) calculation |
| BB Multiplier | Width of the volatility envelope — higher = fewer, stronger signals |
| Chart Theme | Light or dark background compatibility |
A higher Sensitivity setting makes the indicator react faster — useful on 15M or 1H timeframes. Lower Sensitivity on 4H or Daily produces smoother, less frequent, but higher-conviction signals. Start with defaults, run the built-in tester over 3–6 months, then adjust.
08What This Indicator Does Not Do
Honesty matters. The Waddah Attar Explosion is a powerful tool, but it has limits worth understanding before you trade with it:
It does not predict the future. No indicator does. It measures current momentum and volatility conditions, not what happens next.
It can produce losing signals. Even with all four conditions met, the market can reverse. No signal filter eliminates all losses.
It works better in trending conditions. Like all momentum tools, it is less reliable in prolonged sideways or range-bound markets.
It should not be used in isolation. It was designed to work within a broader strategy that includes higher timeframe context, key levels, and proper risk management.
Think of the WAE as a high-quality gatekeeper — it dramatically improves the quality of your entries, but it does not replace a complete trading plan.
09Technical Specifications
The WAE running on a live MT5 chart — compatible with all symbols and timeframes
Get the Indicator
The Waddah Attar Explosion for MT5 is available now on the MQL5 Market. Stop filtering entries by eye — let momentum and volatility do it for you.
↗Conclusion
Fake breakouts are not going away. In fact, as algorithmic liquidity hunting becomes more sophisticated in 2026, low-quality breakout signals are becoming more common, not less.
The Waddah Attar Explosion does not make you a perfect trader — nothing does. But it gives you something invaluable: a clear, objective filter that tells you when momentum and volatility are genuinely aligned, and when they are not.
Stop entering on price alone. Start asking whether the energy is there to back it up.