Description
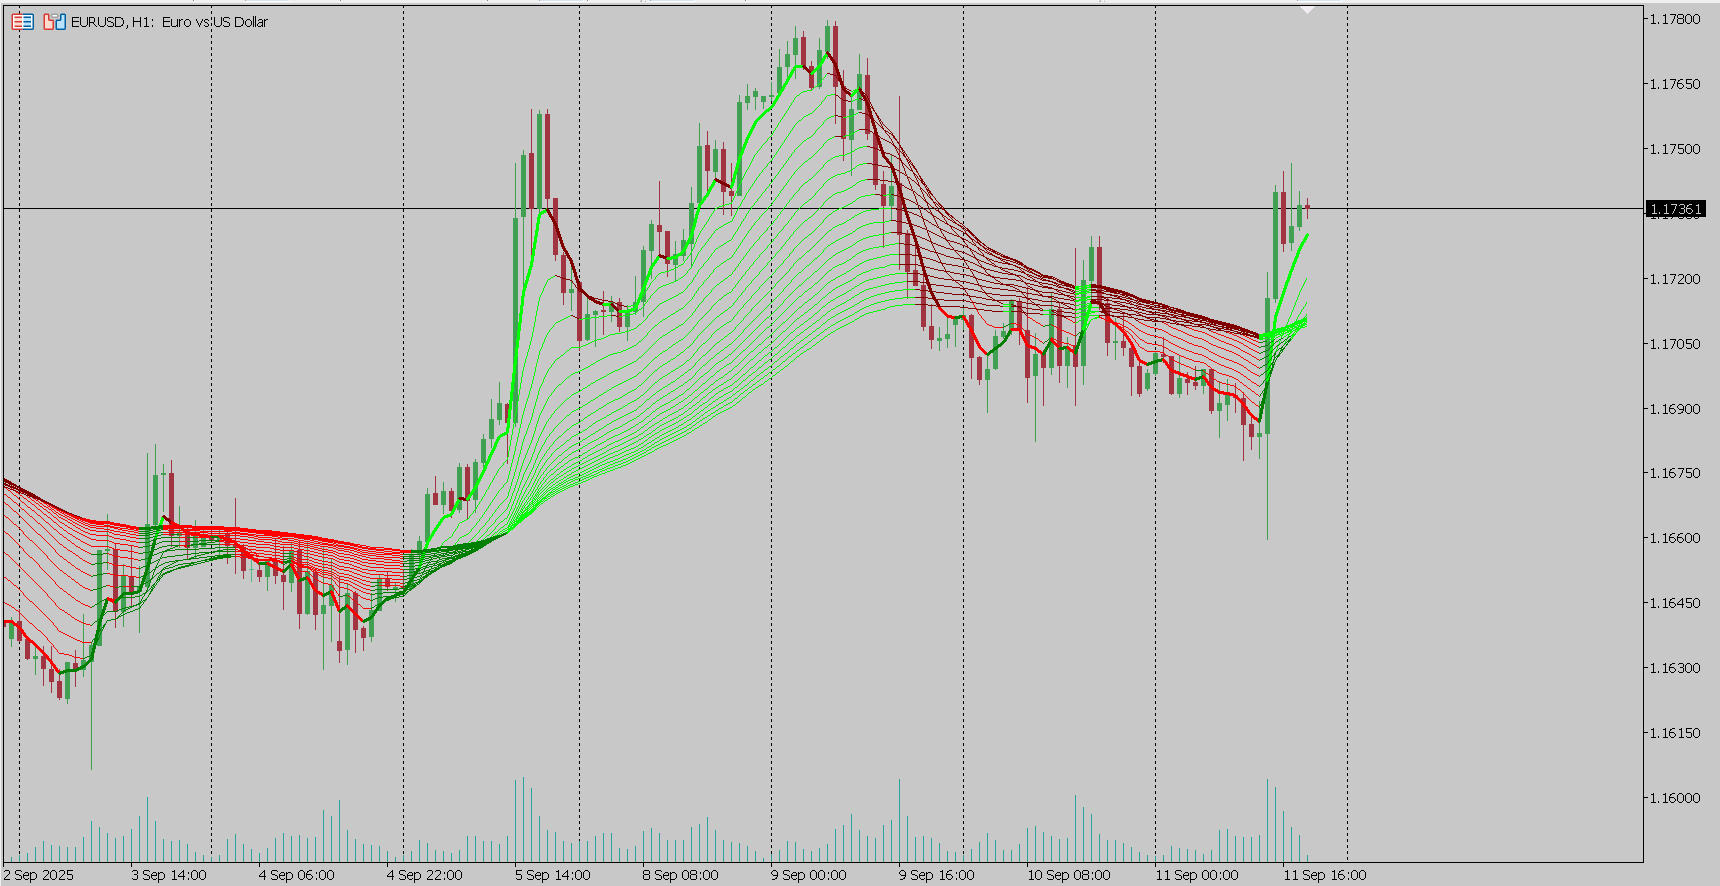
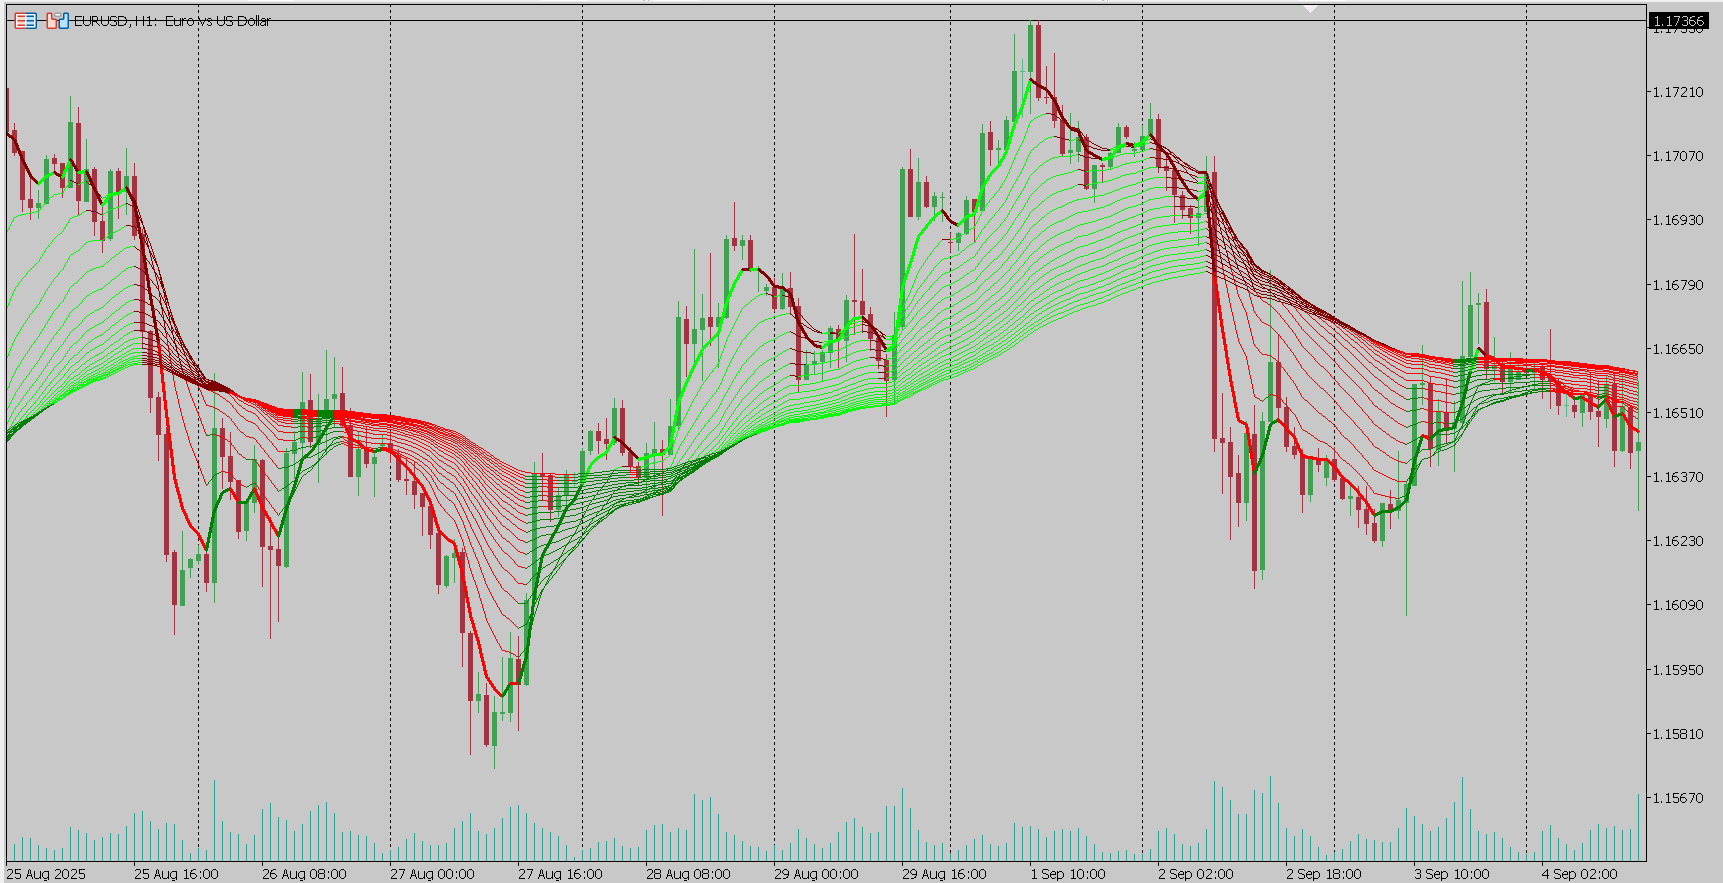
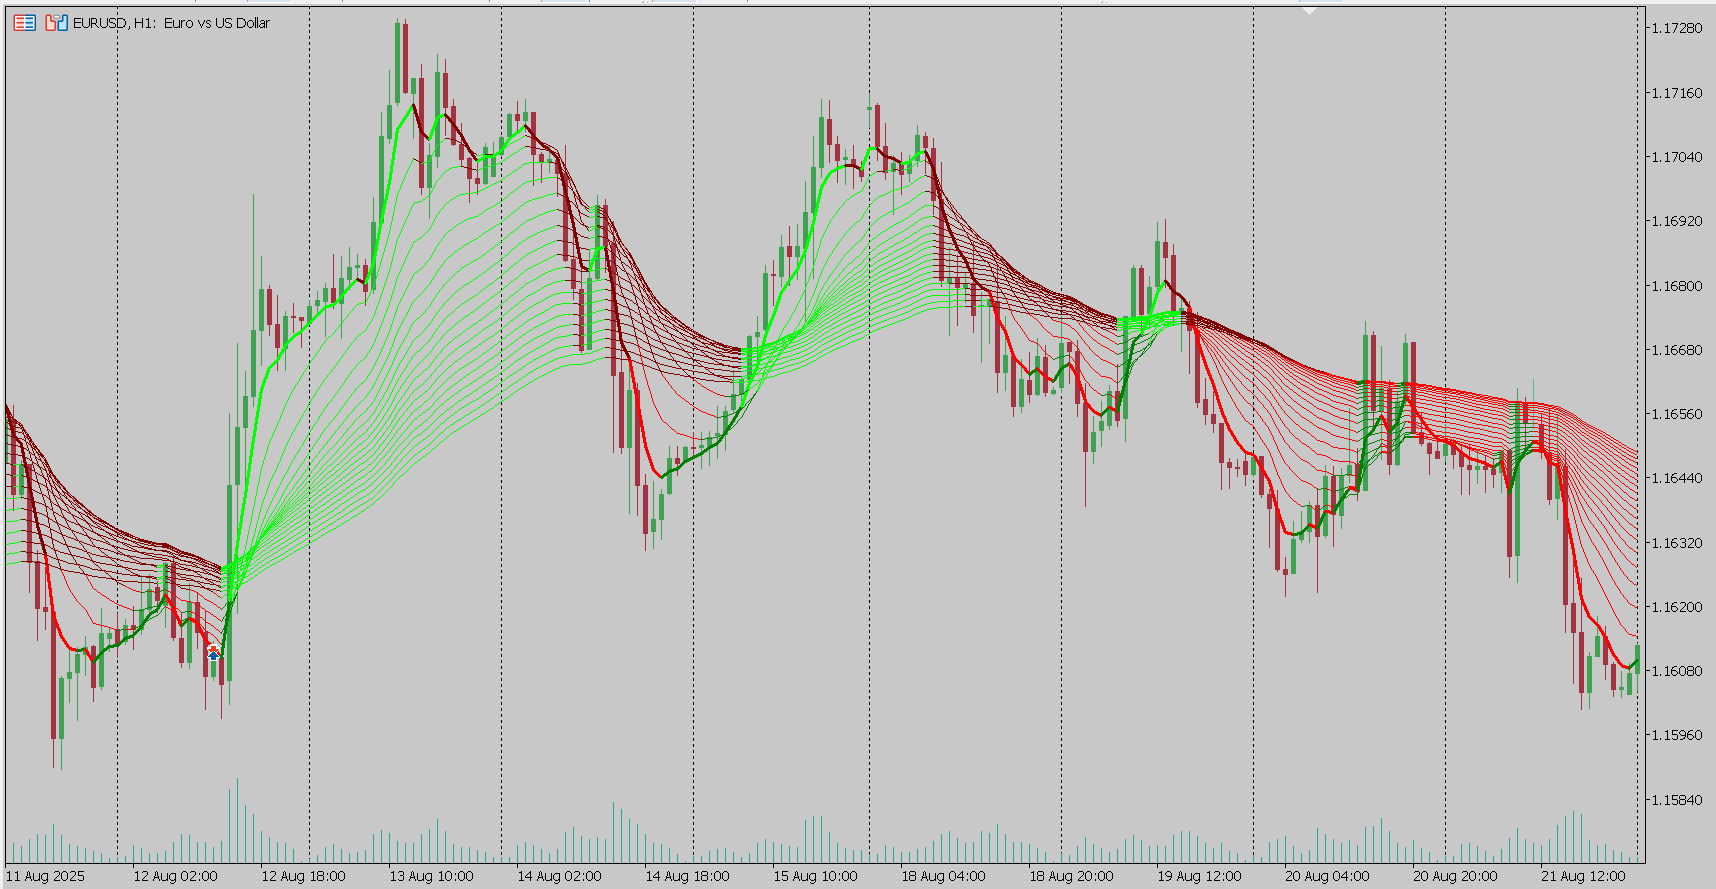
The Madrid Ribbon is a moving average–based trend visualization tool. It combines multiple exponential or simple moving averages into a ribbon structure that adapts to market changes. The indicator highlights trend direction, possible reentry zones, and areas where reversals may occur.

Main features:
- Dynamic Trend Display – Multiple moving averages form a ribbon that reflects the current trend.
- Color Coding –
- Lime: Uptrend
- Green: Pullback or possible reversal warning
- Red: Downtrend
- Maroon: Peak or possible reversal warning
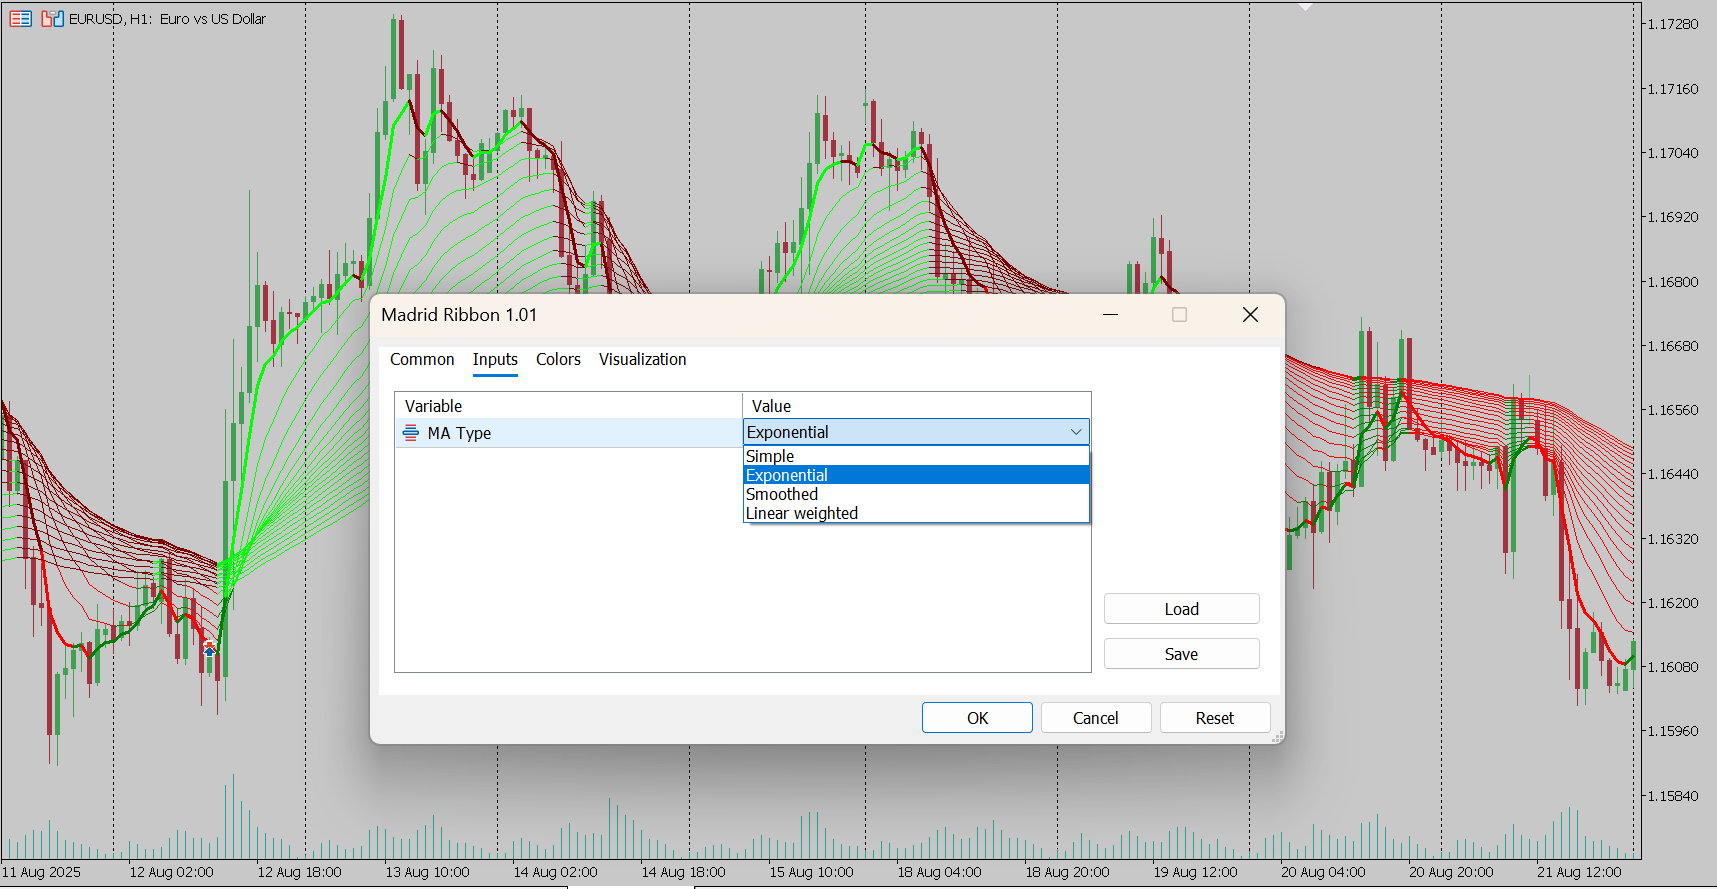
- Configurable Settings – Users can choose between exponential or simple moving averages.
- Clear Visualization – Designed for uncluttered display, with best results on dark chart backgrounds.
How it works:
- Several moving averages are layered to form a ribbon.
- Ribbon color changes according to the prevailing momentum.
- Pullback and potential reversal zones are highlighted to provide additional context for decision-making.
Possible applications:
- Identifying the prevailing market trend.
- Highlighting possible reentry points during pullbacks.
- Spotting areas where reversals may develop.
- Supporting trend-following strategies across Forex, cryptocurrencies, stocks, and indices.